


分布式监控系统--Prometheus
分布式监控系统--prometheus
一、prometheus
1.1 prometheus的介绍
官方:https://prometheus.io
Prometheus 是一套使用go语言开发的开源的系统监控、报警、时间序列数据库框架。适合监控容器平台,它启发于 Google 的 borgmon 监控系统,由工作在 SoundCloud 的 google 前员工在 2012 年创建,作为社区开源项目进行开发,并于 2015 年正式发布。2016 年,Prometheus 正式加入 Cloud Native Computing Foundation,成为受欢迎度仅次于 Kubernetes 的项目。
1.2 数据库的分类
关系型
  mysql,oracle,mariadb,SQLserver,db2,access

非关系型
  文档型:mongodb,elasticsearch
  键值对型:redis,memcache-内存型
  时序型:prometheus
  图关系型:neo4j
1.3 什么是时间序列数据库?
时间序列数据库 (Time Series Database , 简称 TSDB) 是一种高性能、低成本、稳定可靠的在线时间序列数据库,通过时间轴来展示数据,应用的场景很多,如:
1)无人驾驶车辆运行中要记录的经度,纬度,速度,方向,旁边物体的距离等等。每时每刻都要将数据记录下来做分析。
2)某一个地区的各车辆的行驶轨迹数据
3)传统证券行业实时交易数据
4)实时运维监控数据等
1.4 TSDB数据库的优势
1、低成本存储,使用高效压缩算法压缩原始实时数据,可大大节省存储空间(每个采样数据仅占用3.5byte左右大小)
2、安全保障高,提供强用户认证机制,保障数据安全。
3、强计算能力,提供插值、预处理等多种计算方式;支持多种聚合函数。
4、高可靠服务,三副本、分布式部署,保证数据可靠性。
5、灵活高效,支持数据配额限制,采用先进先出(FIFO)的策略,将过期的数据进行清除。
6、便捷调用,可支持通过REST API方式、高并发写入时间序列数据。
7、多场景应用,适合物联网设备监控场景和互联网业务监控等多种场景应用。
8、使用简单,控制台可提供专业丰富的运维及数据管理功能,大大简化客户的操作,让客户可以轻松完成所需数据的管理使用。
1.5 prometheus的历史
2015
GitHub 完全开源后,STAR数直逼9k,同时也被很多公司作为监控方案采用;

2016
[Prometheus]加入 CNCF(云原生计算基金会),继 Kubernetes 加入后的第二个项目成员。

2017
Prometheus 2.0 发布,这是Prometheus的一个重要的里程碑,在集成TSDB后的Prometheus 2.0,与Prometheus 1.8相比,CPU使用率降低到20%-40%,磁盘I/O、磁盘空间使用率降低到33%-50%,查询负载通常平均<1%;

2020
时至今日,版本已经迭代到2.32.1 ,STAR数已超30k,已经是云原生不可分割的重要一部分
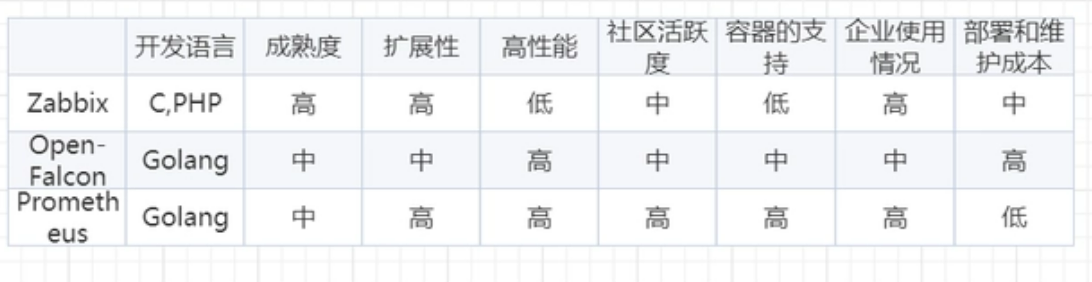
1.6 prometheus和zabbix的对比
1.7 监控的分类
•业务监控 可以包含 用户访问QPS,DAU日活,访问状态,业务接口,产品转化率,充值额度,用户投诉 等等这些很宏观的概念
•系统临控 主要是跟操作系统相关的 基本监控项 CPU/ 内存/ 硬盘IO / TCP链接/流量 等等
•两络站控 对网络状态的监控 互联网公司必不可少 但是很多时候又被忽略例如:丟包率 延迟 等等
•日志监控 监控中的重头戏,往往单独设计和搭建, 全部种类的日志都有需要采集
•程序监控 一般需要和开发人员配合,程序中嵌入各种接口 直接获取数据 或者特质的日志格式(埋点)
二、prometheus的架构
2.1 prometheus架构
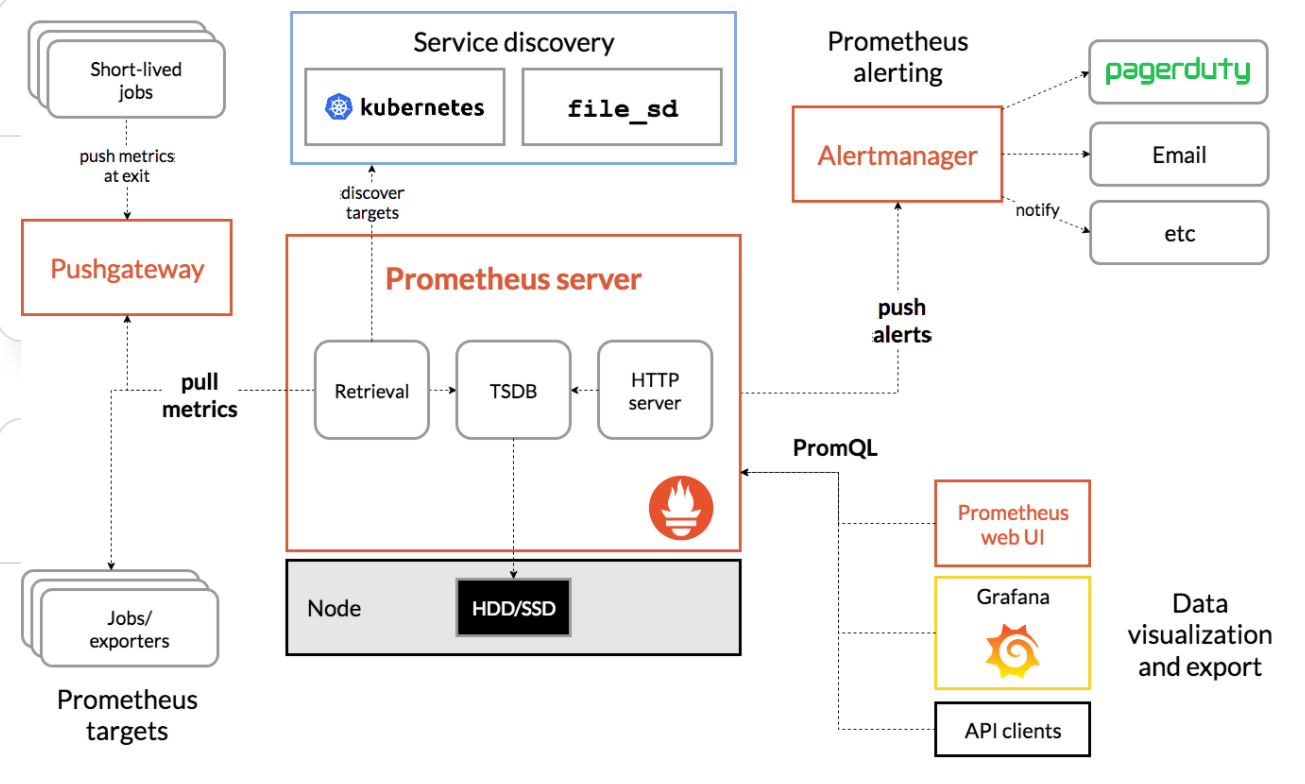
如上架构理解
1)存储计算层
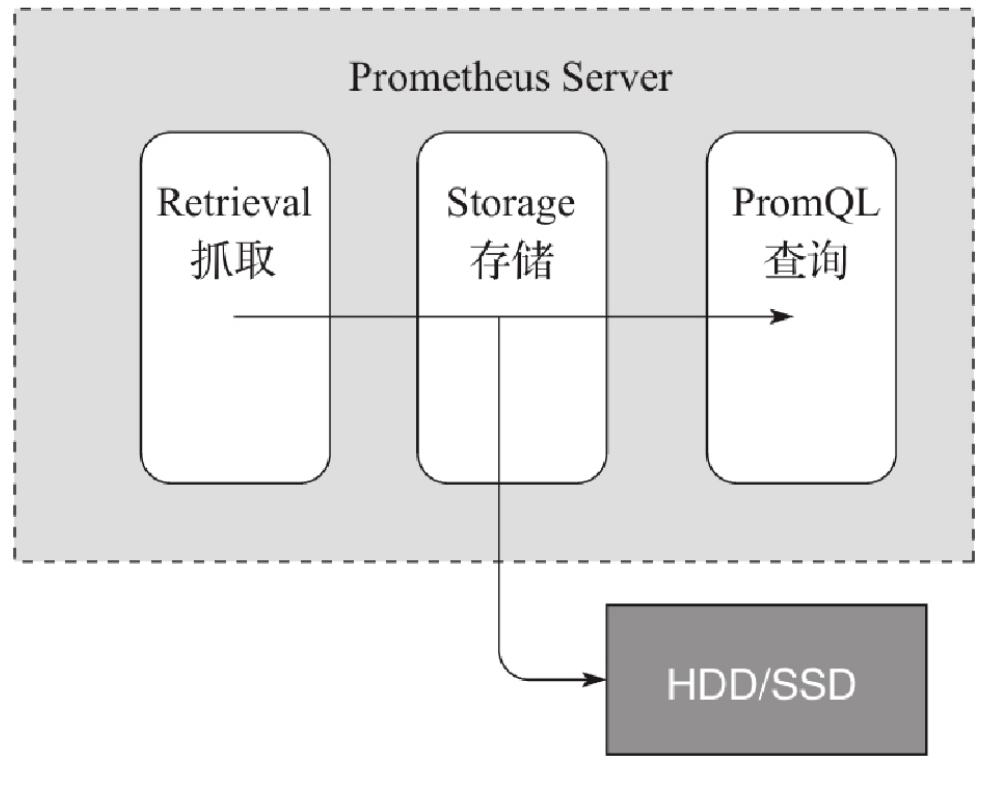
- Prometheus Server里面包含了存储引擎和计算引擎
- Retrieval组件为取数组件,它会主动从Pushgateway或者Exporter拉取指标数据
- Server Discovery,可以动态发现要监控的目标
- TSDB,数据核心存储与查询
- HTTP server 对外提供HTTP服务
2) 采集层
- 采集层分两类,一类是生命周期较短的作业,还有一类是生命周期较长的作业
- 短作业:直接通过API,在退出时间指标推送给Pushgateway
- 长作业:Retrieval组件直接从Job或者exporter拉取数据
3) 应用层
- 应用层主要分为两种,一种是AlertManager,另一种是数据可视化
- AlertManager
- 对接Pagerduty,是一套付费的监控报警系统,可实现短信告警,五分钟无人ack打电话通知,仍然无人ack,通知值班人员Manager、发邮件......
- 数据可视化
- Prometheus web UI
- Grafana
- API Clients
2.2 四大组件
1)Prometheus Server : 根据配置完成数据采集,数据存储,根据告警规则产生告警并发送给Alertmanager,提供PromQL查询语言的支持。
2)Push Gateway : 为应对部分push场景提供的插件,这部分监控数据先推送到 Push Gateway 上,然后再由 Prometheus Server端拉取 。用于存在时间较短,可能在 Prometheus 来拉取之前就消失了的 jobs (若 Prometheus Server 采集间隔期间,Push Gateway 上的数据没有变化, Prometheus Server 将采集到2次相同的数据,仅时间戳不同)
3)Exporters:Exporters(探针) 是Prometheus的一类数据采集组件的总称。它负责从目标处搜集数据,并将其转化为Prometheus支持的格式。它并不向中央服务器发送数据,而是等待中央服务器主动前来抓取。
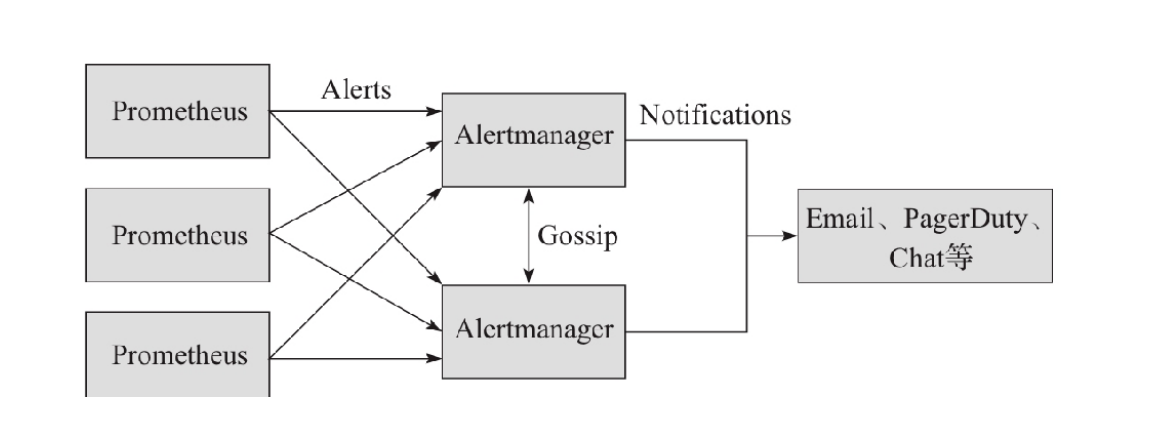
4)Alertmanager: Prometheus server 主要负责根据基于PromQL的告警规则分析数据,如果满足PromQL定义的规则,则会产生一条告警,并发送告警信息到Alertmanager,Alertmanager则是根据配置处理告警信息并发送。常见的接收方式有:电子邮件,webhook,微信 等。Alertmanager三种处理告警信息的方式:分组,抑制,静默。
2.3 prometheus的优点和缺点
2.3.1 prometheus的优点
1. 多维度数据模型

2. 灵活的查询语言-PQL

3. 不依赖分布式存储,单个服务器节点是自主的

4. 以HTTP方式,通过pull模型拉去时间序列数据

5. 也可以通过中间网关支持push模型

6. 通过服务发现或者静态配置,来发现目标服务对象
    1)静态配置
    静态文件配置是一种传统的服务发现方式
    适用于有固定的监控环境,IP地址和统一的服务接口的场景
    需要在配置中指定采集的目标信息
比如:
  "targets": ["192.168.1.101:8080"]
   targers:
     - 192.168.1.101
     - 192.168.1.102


    2)动态发现
     比较适用于云环境下,动态伸缩,迅速配置
     容器管理系统,各种云管平台、各种服务发现组件
K8S为例:
   需要配置API的地址和认证配置
   prometheus一直监听集群的变化
   获取新增/删除集群中机器的信息,并更新采集对象的列表

7. 支持多种多样的图表和界面展示


8、精细的数据采样,理论上可以到秒级 //数据存储
2.3.2 prometheus的缺点
不支持集群化 ,新版本支持联邦

被监控集群规模较大的情况下,有性能瓶颈

2.0以前的版本偶尔发生数据丢失 ,2.0之后已改进

中文支持不好,中文资料较少
2.4 联邦
一个Prometheus服务节点所能接管的主机数量有限。而联邦模式允许 Prometheus 服务器从另一个 Prometheus 服务器抓取特定数据。
2.5 联邦分类
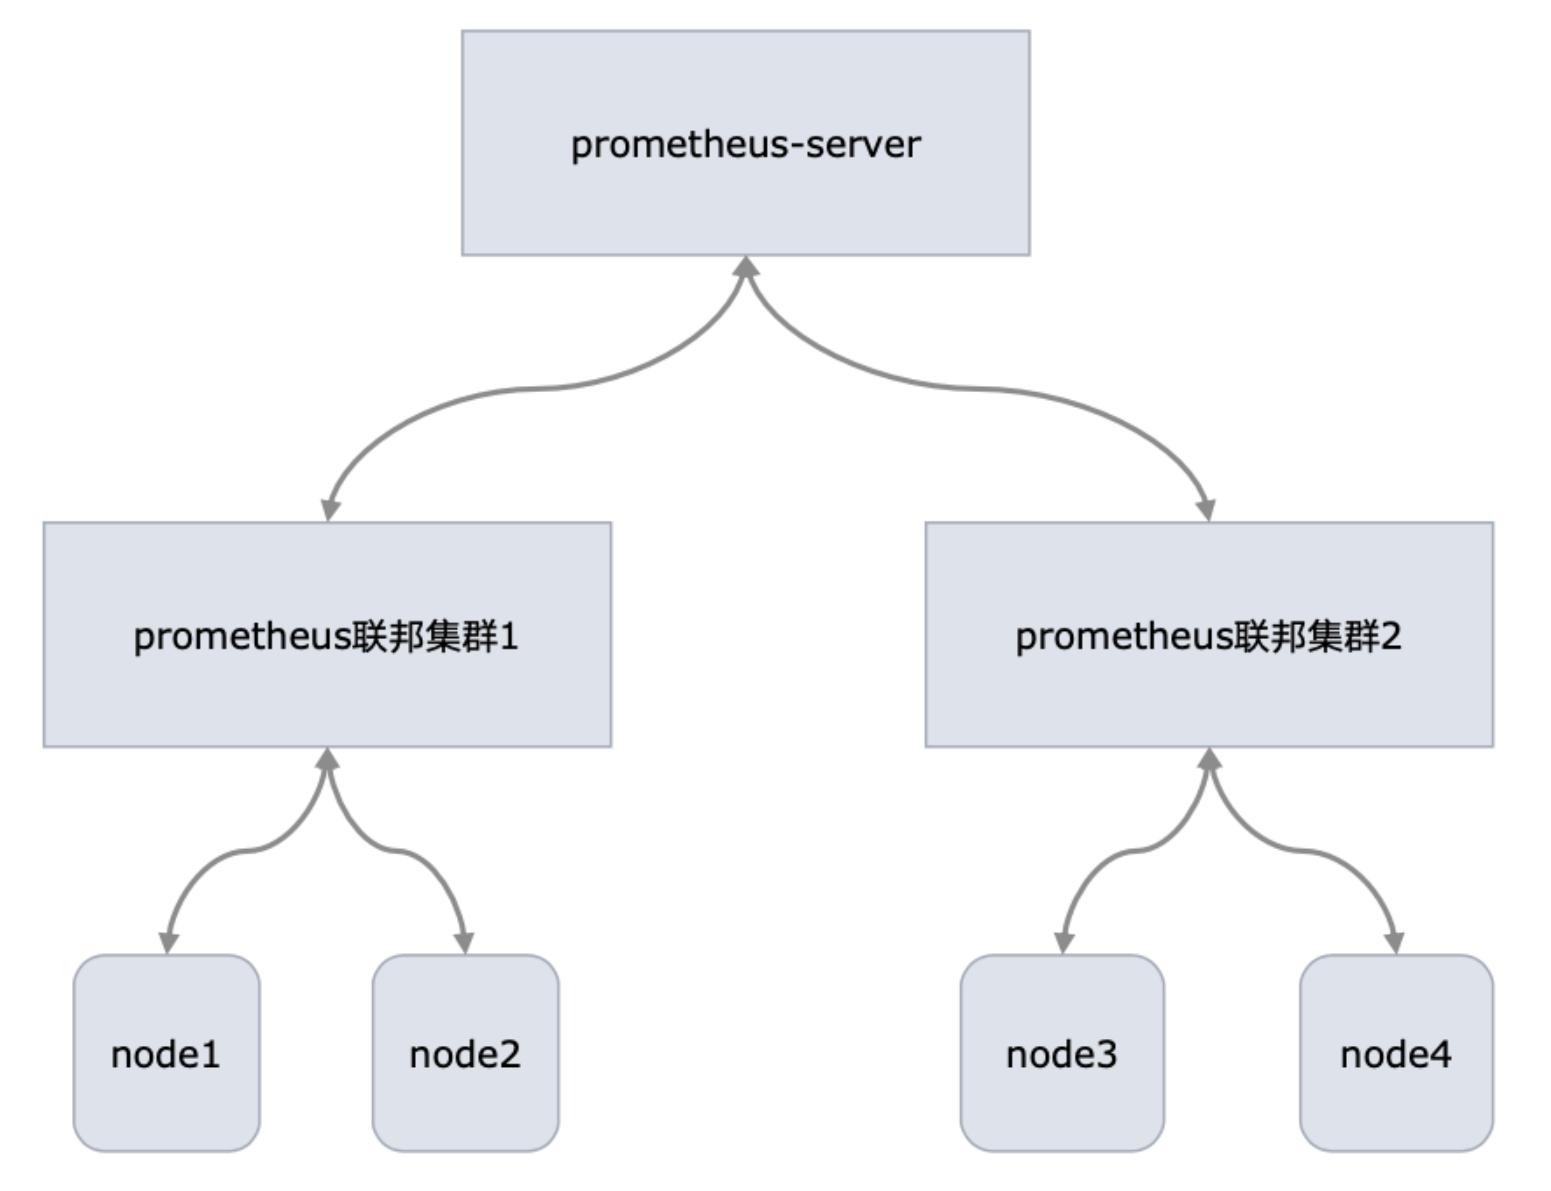
2.5.1 跨数据中心的联邦集群
例如,一个联邦设置可能由多个数据中心中的 Prometheus 服务器和一套全局 Prometheus 服务器组成。每个数据中心中部署的 Prometheus 服务器负责收集本区域内细粒度的数据(实例级别),全局 Prometheus 服务器从这些下层 Prometheus 服务器中收集和汇聚数据(任务级别),并存储聚合后的数据。这样就提供了一个聚合的全局视角和详细的本地视角。
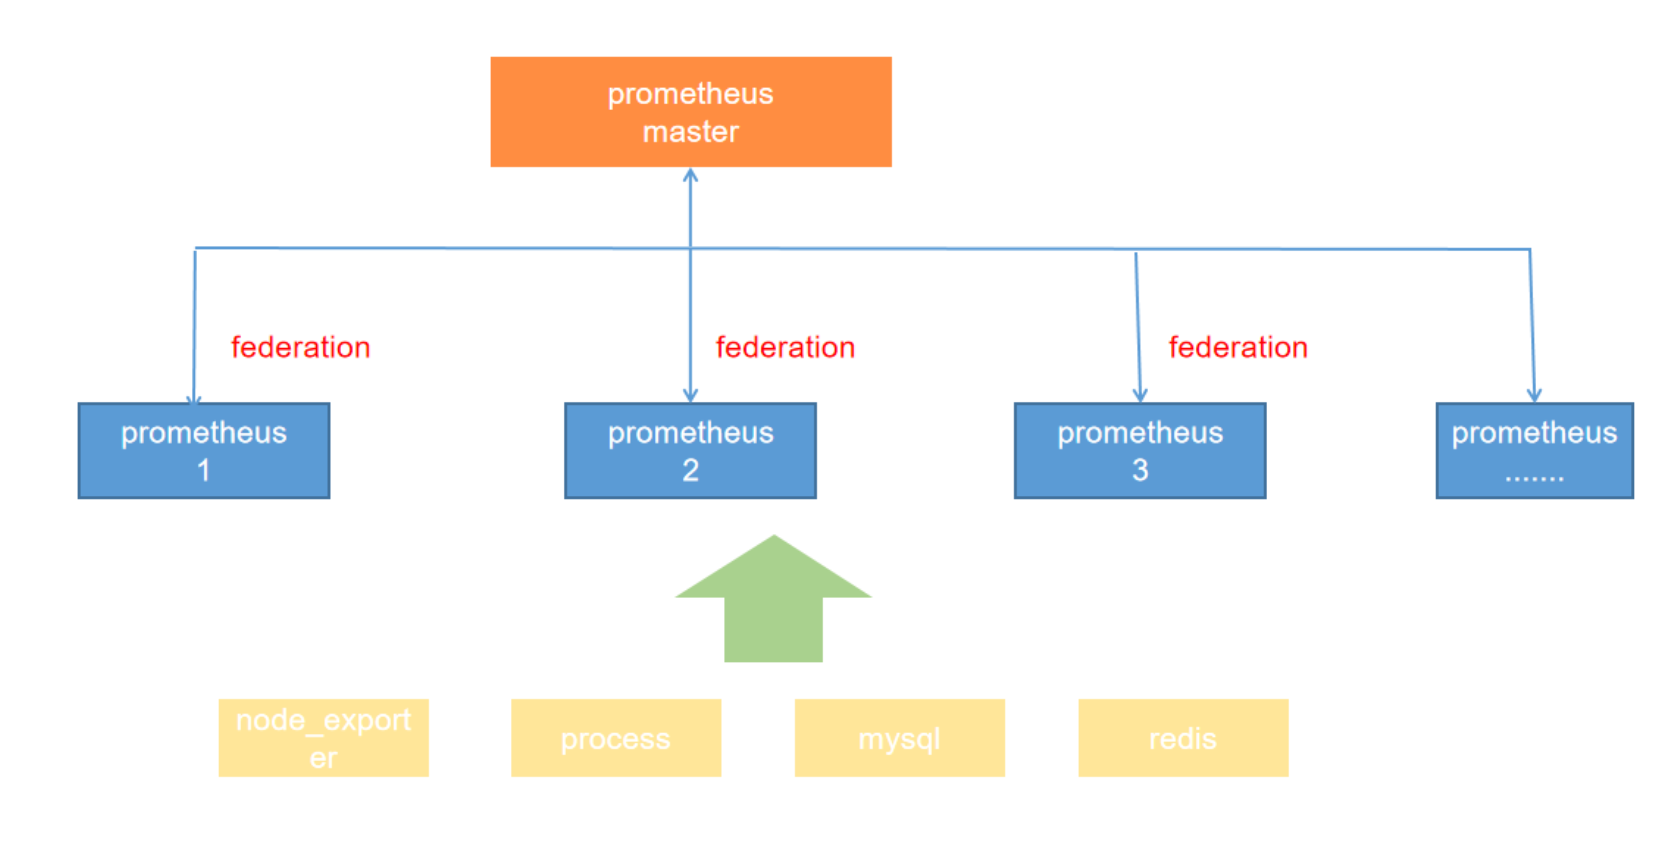
2.5.2 跨服务的集群联邦
同一服务器里不同的服务监控指标用不同的prometheus联邦节点收集监控数据

例如,一个运行多种服务的集群调度器可以暴露在集群上运行的服务实例的资源使用信息(例如内存和 CPU 使用率)。另一方面,运行在集群上的服务只需要暴露指定应用程序级别的服务指标。通常,这两种指标集分别被不同的 Prometheus 服务器抓取。利用联邦,监控服务级别指标的 Prometheus 服务器也可以从集群中 Prometheus 服务器拉取其特定服务的集群资源使用率指标,以便可以在该 Prometheus 服务器中使用这两组指标集
2.6 prometheus的数据类型
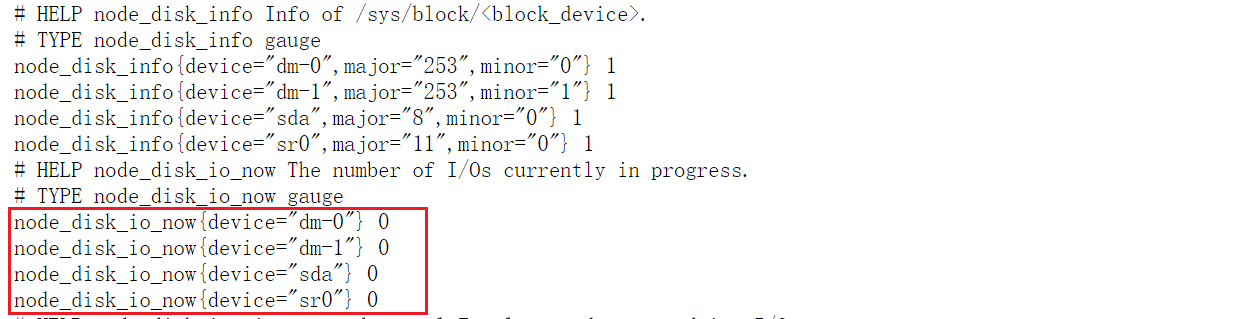
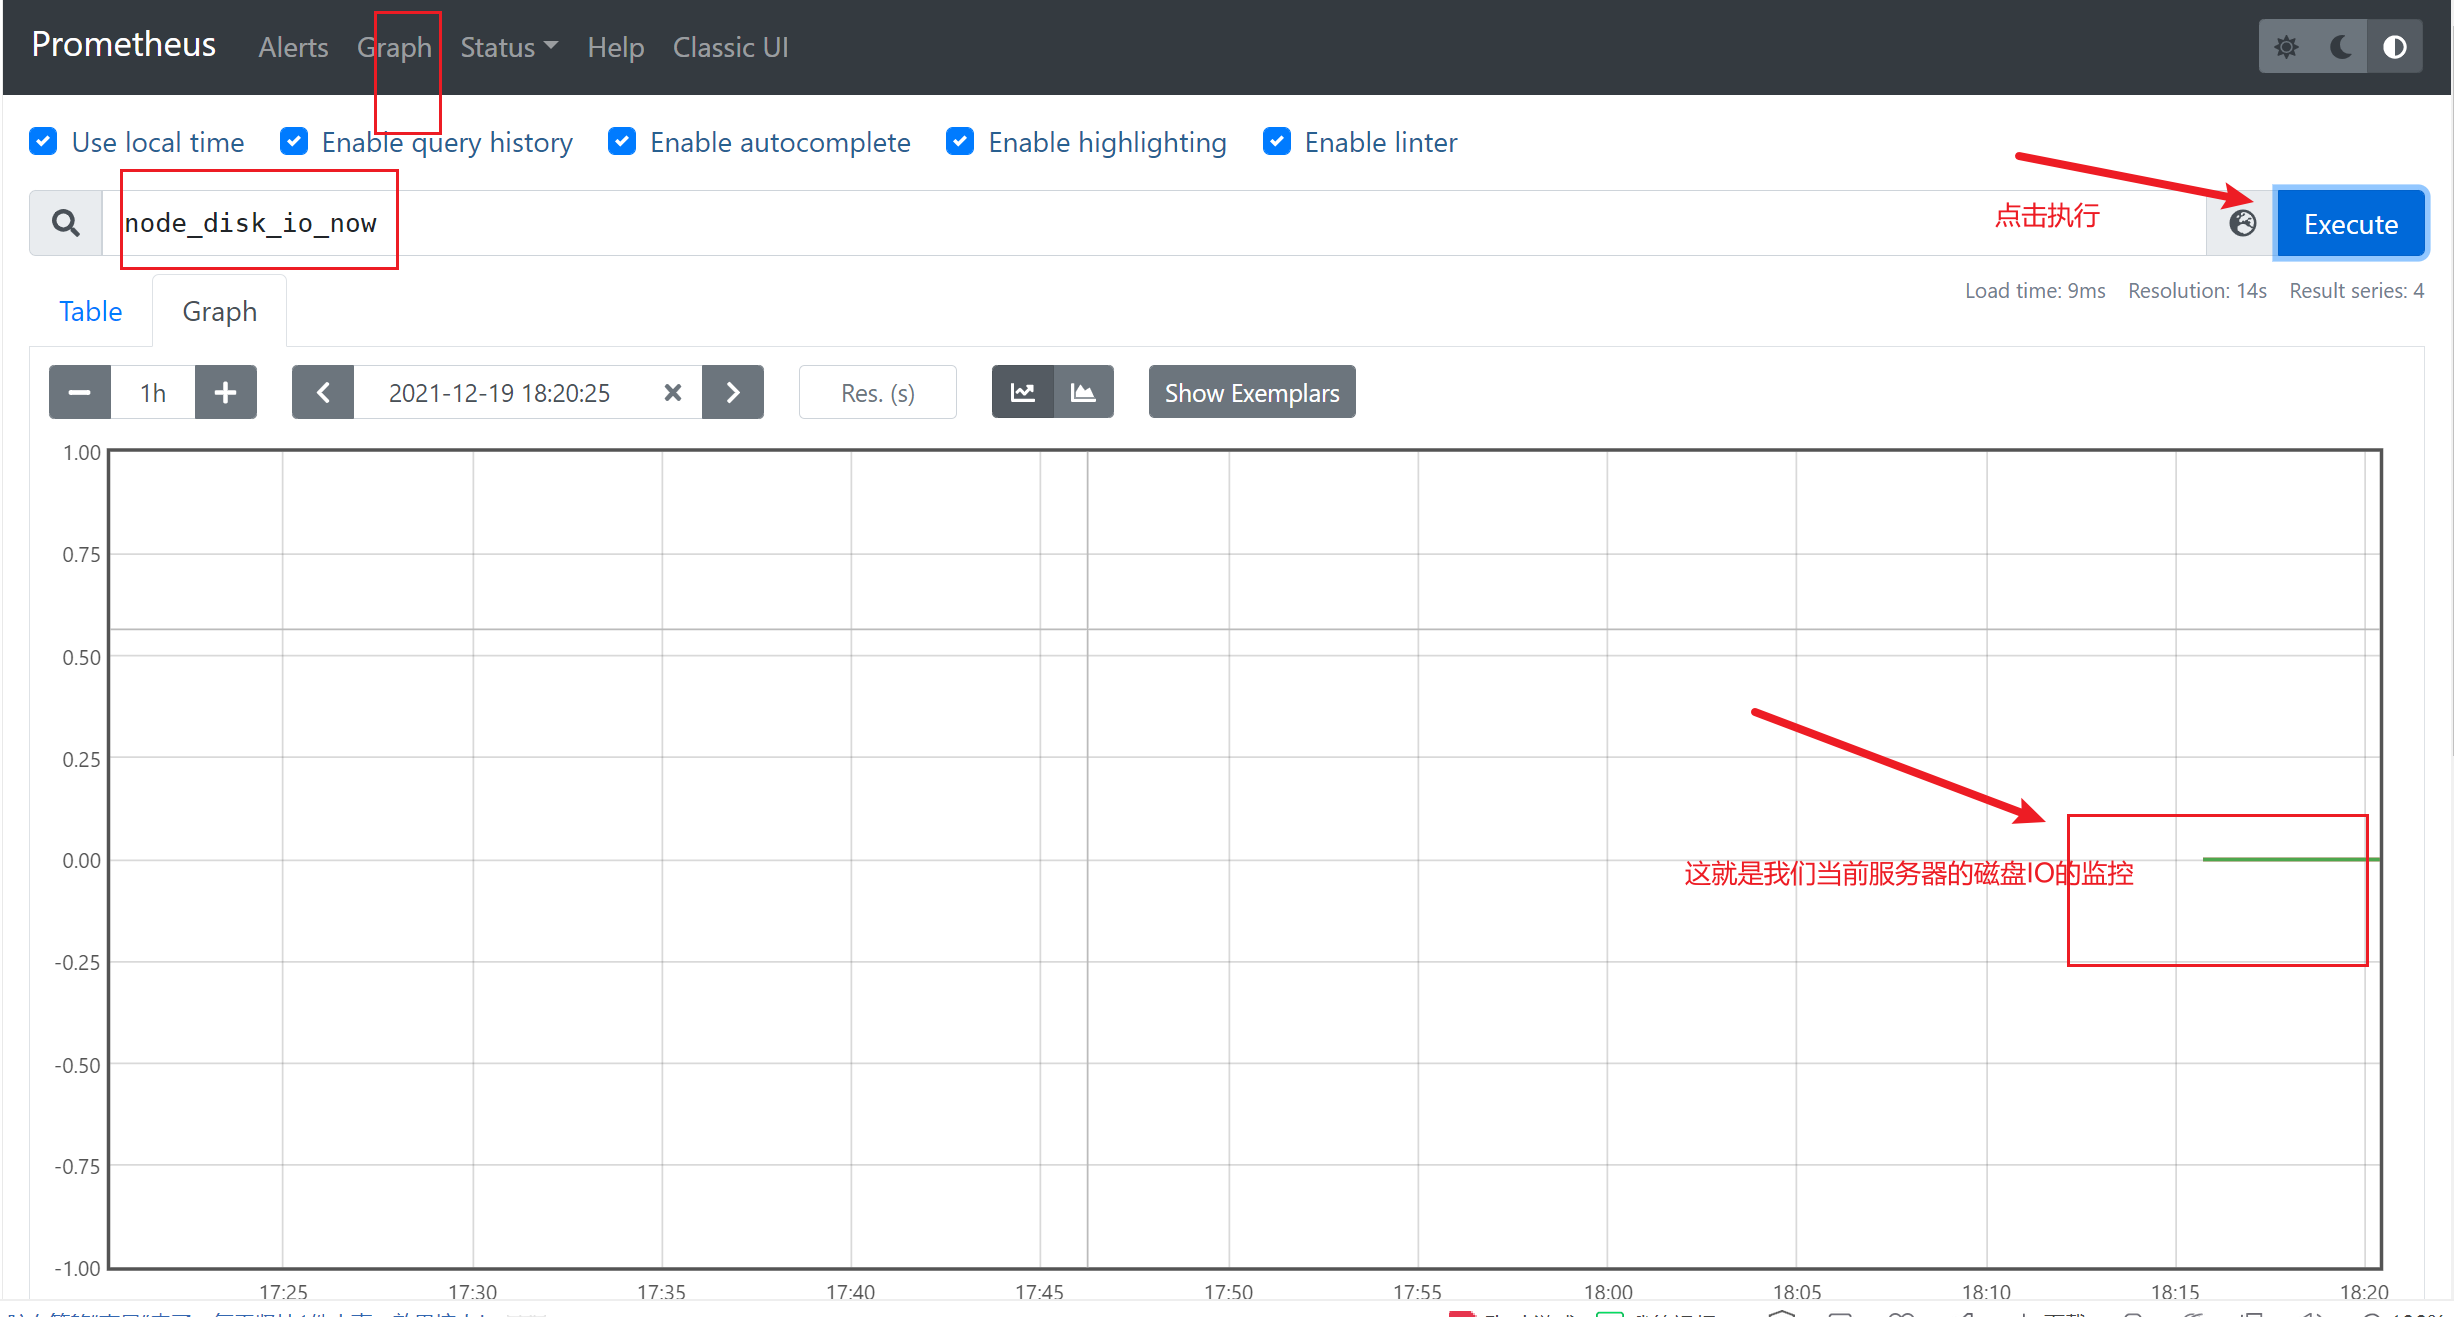
(1)Metric 名字 时间序列的名称通常描述收集的时间序列数据的一般性质——例如:node_disk_io_now表示当前磁盘的IO。 名称可以包含ASCII字母、数字、下划线和冒号。
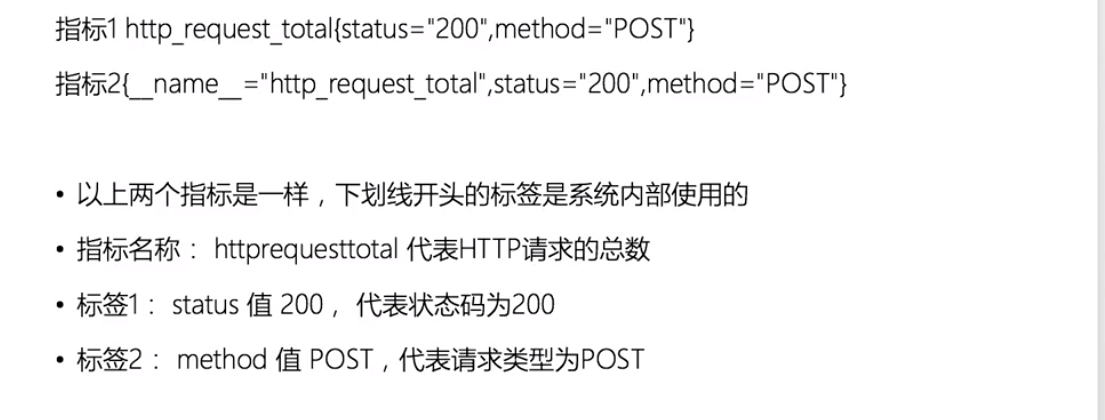
(2)标签(Labels) 以 _ _ 为前缀的标签名称保留给普罗米修斯内部使用。
·体现标签的维度特性,用于过滤和聚合
·通过标签名和标签值组成,键值对形式组成多种维度
实例说明:
(3) 时间序列元素
(4) Metric 保留时长
普罗米修斯是为短期监视和警报需求而设计的。默认情况下,它在本地数据库中保存了15天的时间序列。如果您 希望保留更长时间的数据,建议的方法是将所需的数据发送到远程的第三方平台(influxdb)。普罗米修斯具有向外部数据存 储写入的能力。
(5)安全模型
普罗米修斯可以通过多种方式进行配置和部署。它对信任做了两个宽泛的假设:
• 不受信任的用户将能够访问普罗米修斯服务器的HTTP API,从而访问数据库中的所有数据。

• 只有受信任的用户才能访问Prometheus及其组件的命令行、配置文件、规则文件和运行时配置。
由于Prometheus 2.0, HTTP API的一些管理元素默认会被禁用。 因此,普罗米修斯及其组件不提供任何服务器端身份验证、授权或加密。如果您在一个更安全的环境中工作, 您将需要实现额外的控制——例如,通过使用反向代理提前终止Prometheus服务器,或者代理您的 exporter。
2.7 在prometheus下指标分类
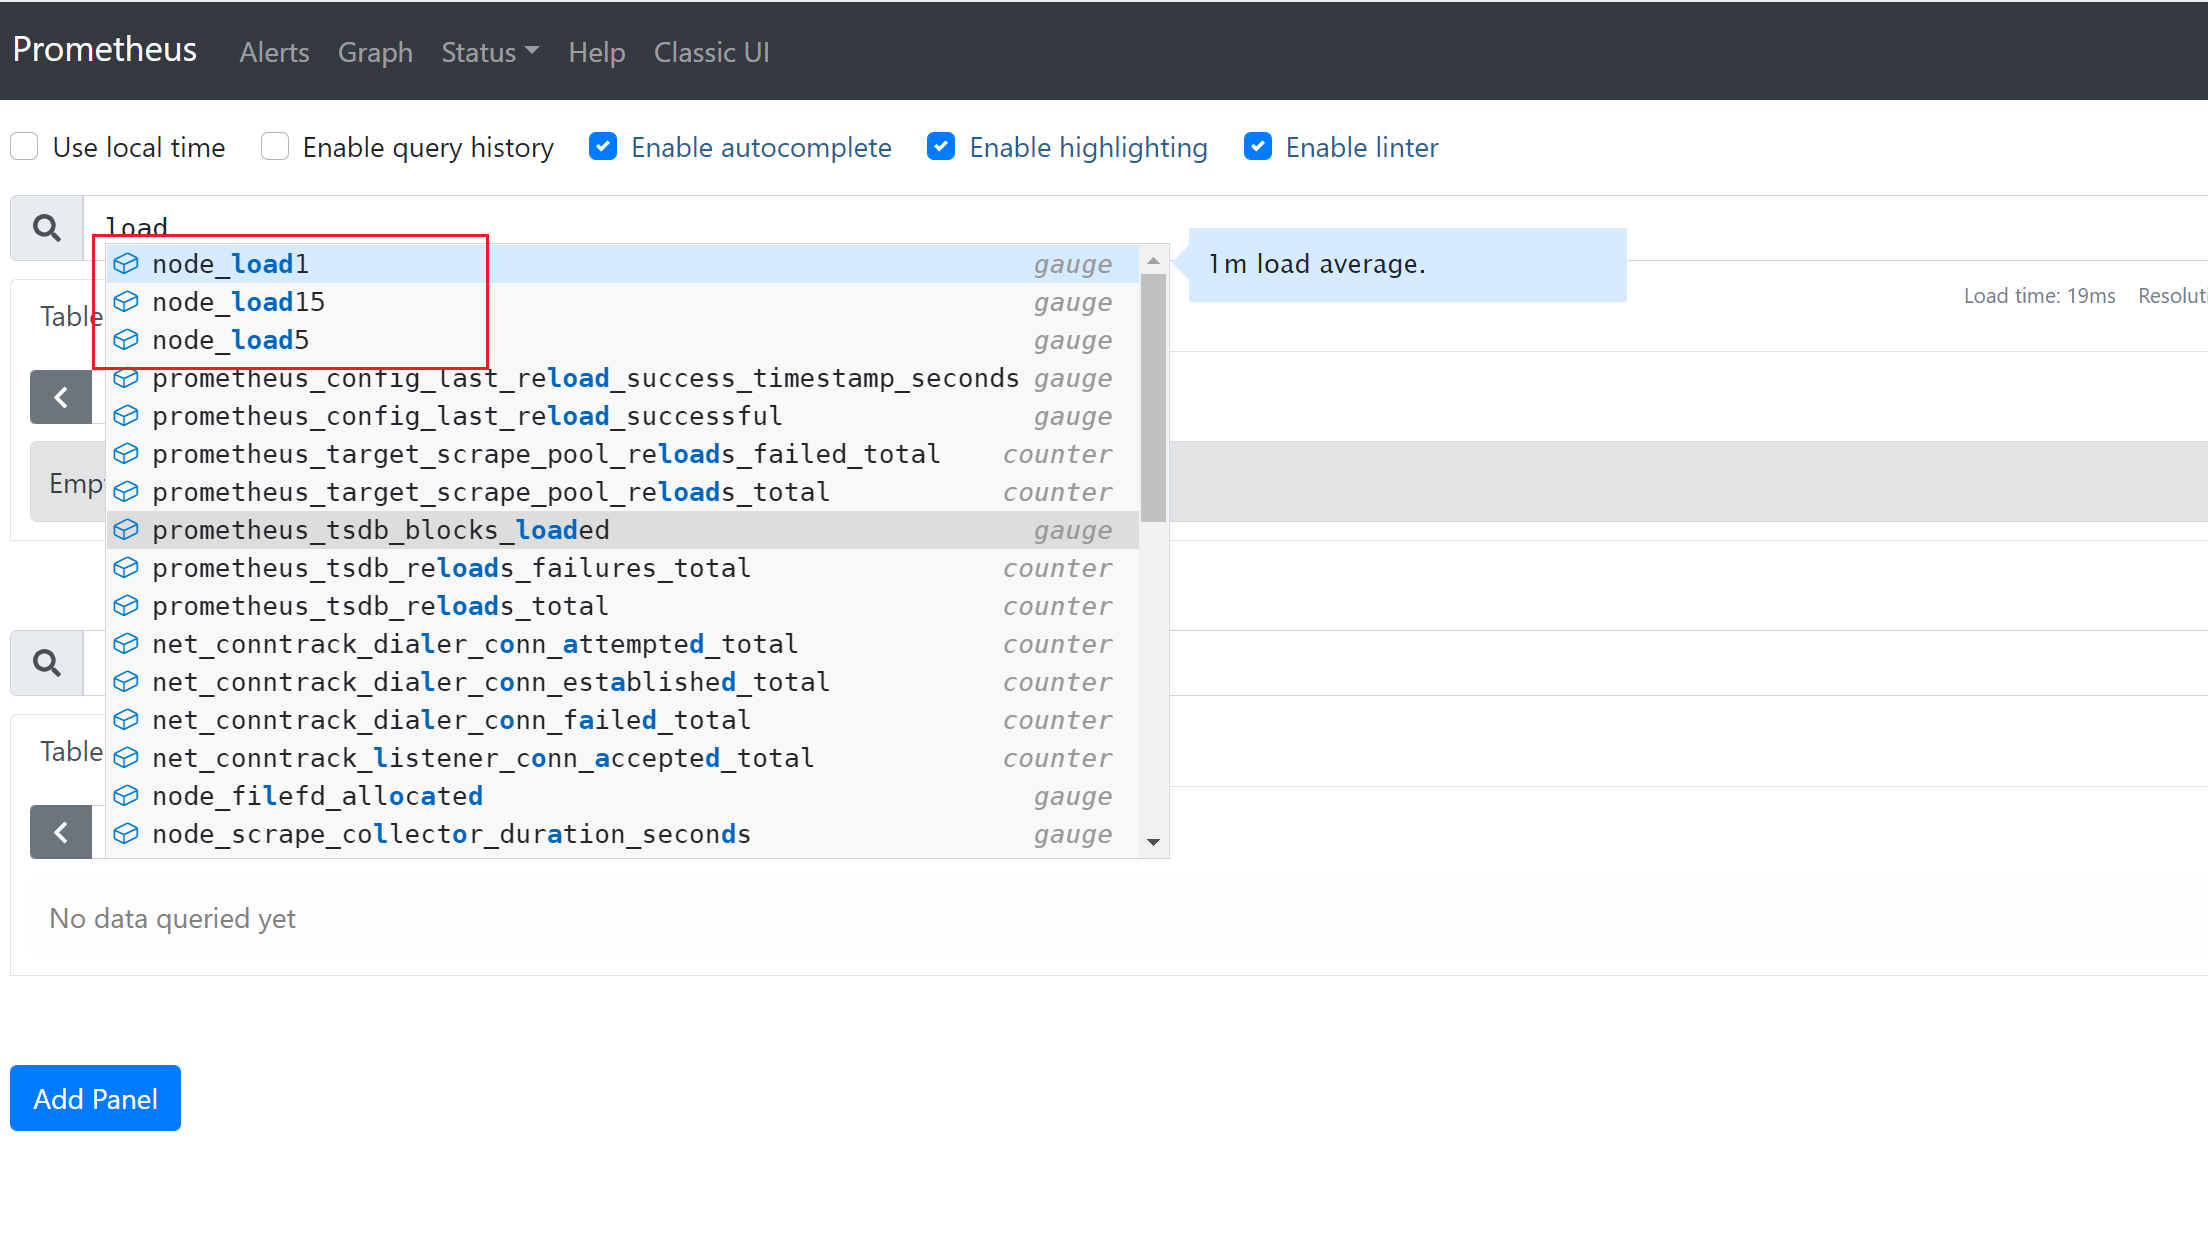
从存储上来讲所有的监控指标都是相同的,但是在不同的场景下这些指标又有一些细微的差异。 例如,在 Node Exporter 返回的样本中指标 node_load1 反应的是当前系统的负载状态,随着时间的变化这个指标返回的样本数据是在不断变化的。而指标 node_cpu_seconds_total 所获取到的样本数据却不同,它是一个持续增大的值,因为其反应的是 CPU 的累计使用时间,从理论上讲只要系统不关机,这个值是会一直变大。
为了能够帮助用户理解和区分这些不同监控指标之间的差异,Prometheus 定义了 4 种不同的指标类型:Counter(计数器)、Gauge(仪表盘)、Histogram(直方图)、Summary(摘要)。
在 node-exporter返回的样本数据中,其注释中也包含了该样本的类型。例如:
# HELP node_cpu_seconds_total Seconds the cpus spent in each mode.
# TYPE node_cpu_seconds_total counter
node_cpu_seconds_total{cpu="cpu0",mode="idle"} 362812.7890625
2.7.1 Counter
Counter (只增不减的计数器) 类型的指标其工作方式和计数器一样,只增不减,所以它对于存储诸如服务的 HTTP 请求数量或使用的 CPU 时间之类的信息非常有用。常见的监控指标,如 http_requests_total、node_cpu_seconds_total 都是 Counter 类型的监控指标。
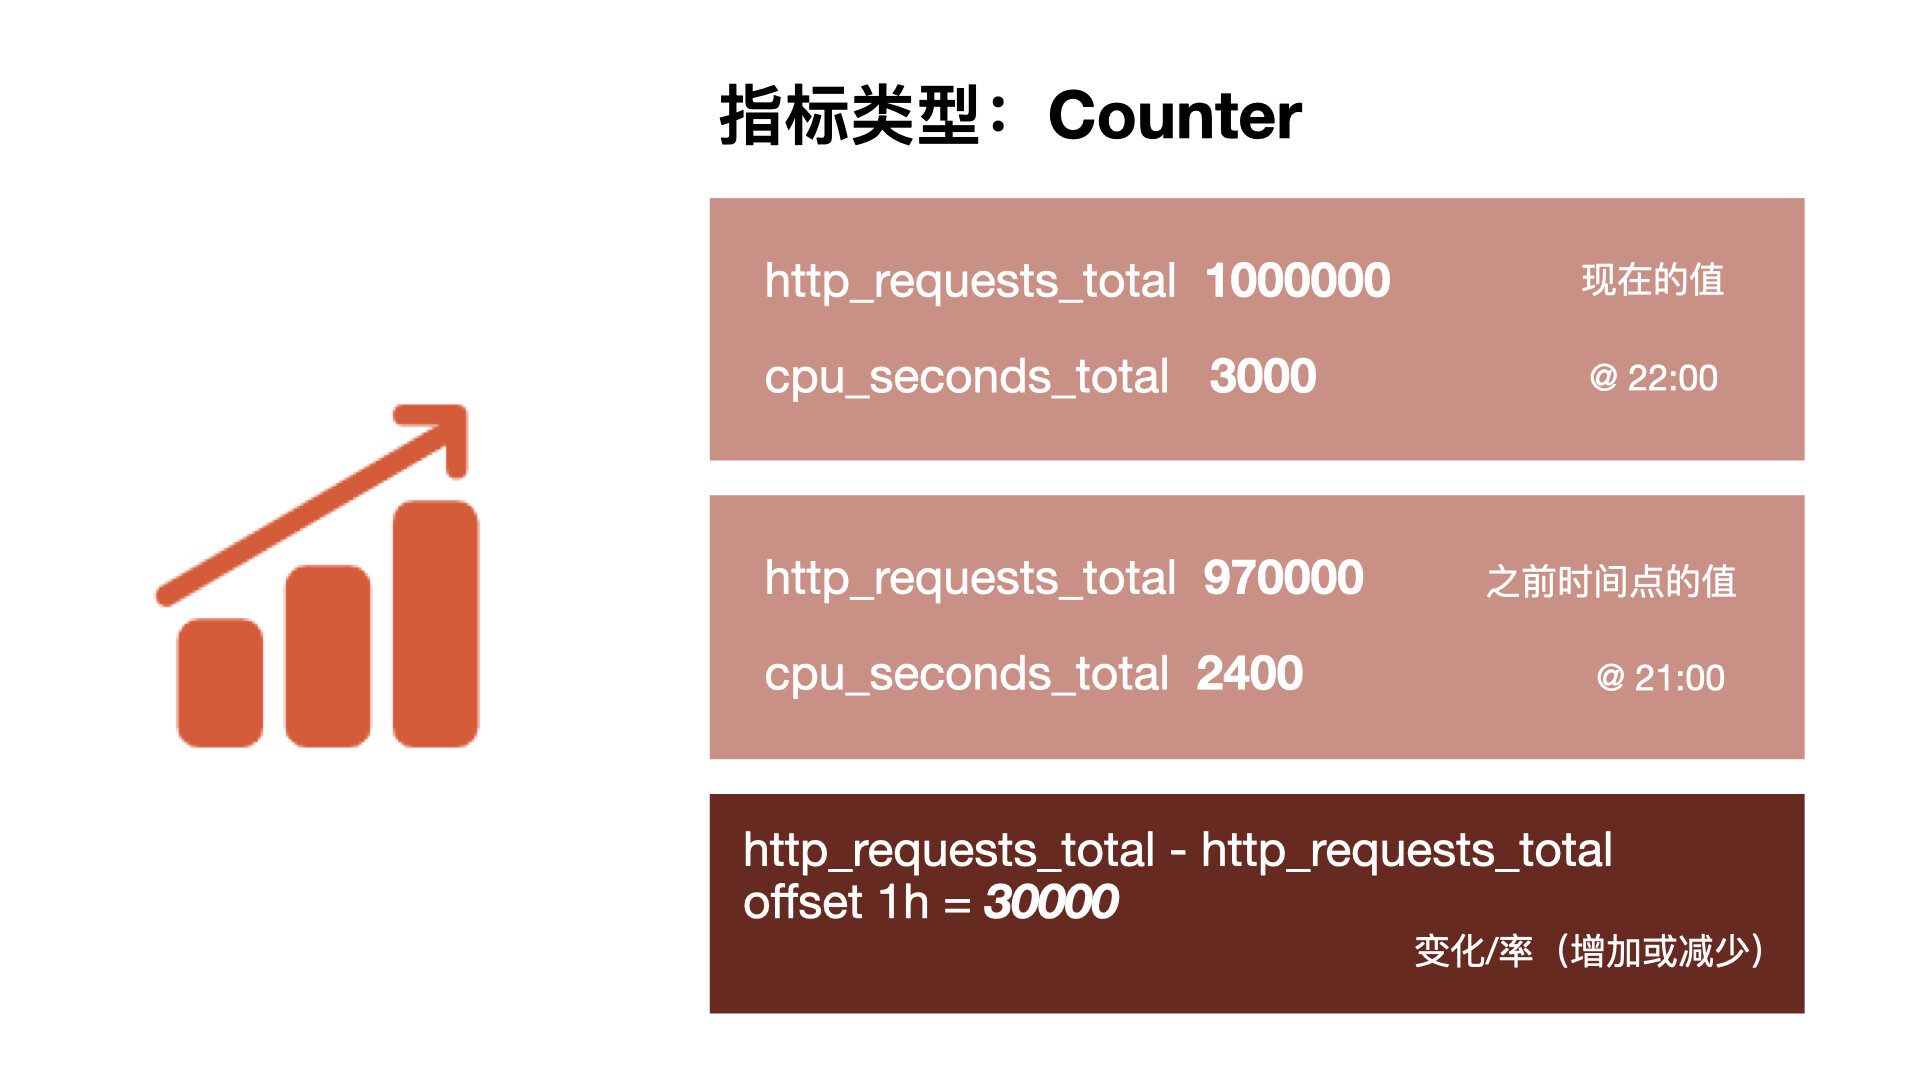
可能你会觉得一直增加的数据没什么用处,了解服务从开始有多少请求有什么价值吗?但是需要记住,每个指标都存储了时间戳的,所有你的 HTTP 请求数现在可能是 1000 万,但是 Prometheus 也会记录之前某个时间点的值,我们可以去查询过去一个小时内的请求数,当然更多的时候我们想要看到的是请求数增加或减少的速度有多快,因此通常情况对于 Counter 指标我们都是去查看变化率而不是本身的数字。PromQL 内置的聚合操作和函数可以让用户对这些数据进行进一步的分析,例如,通过 rate() 函数获取 HTTP 请求的增长率:
rate(http_requests_total[5m])
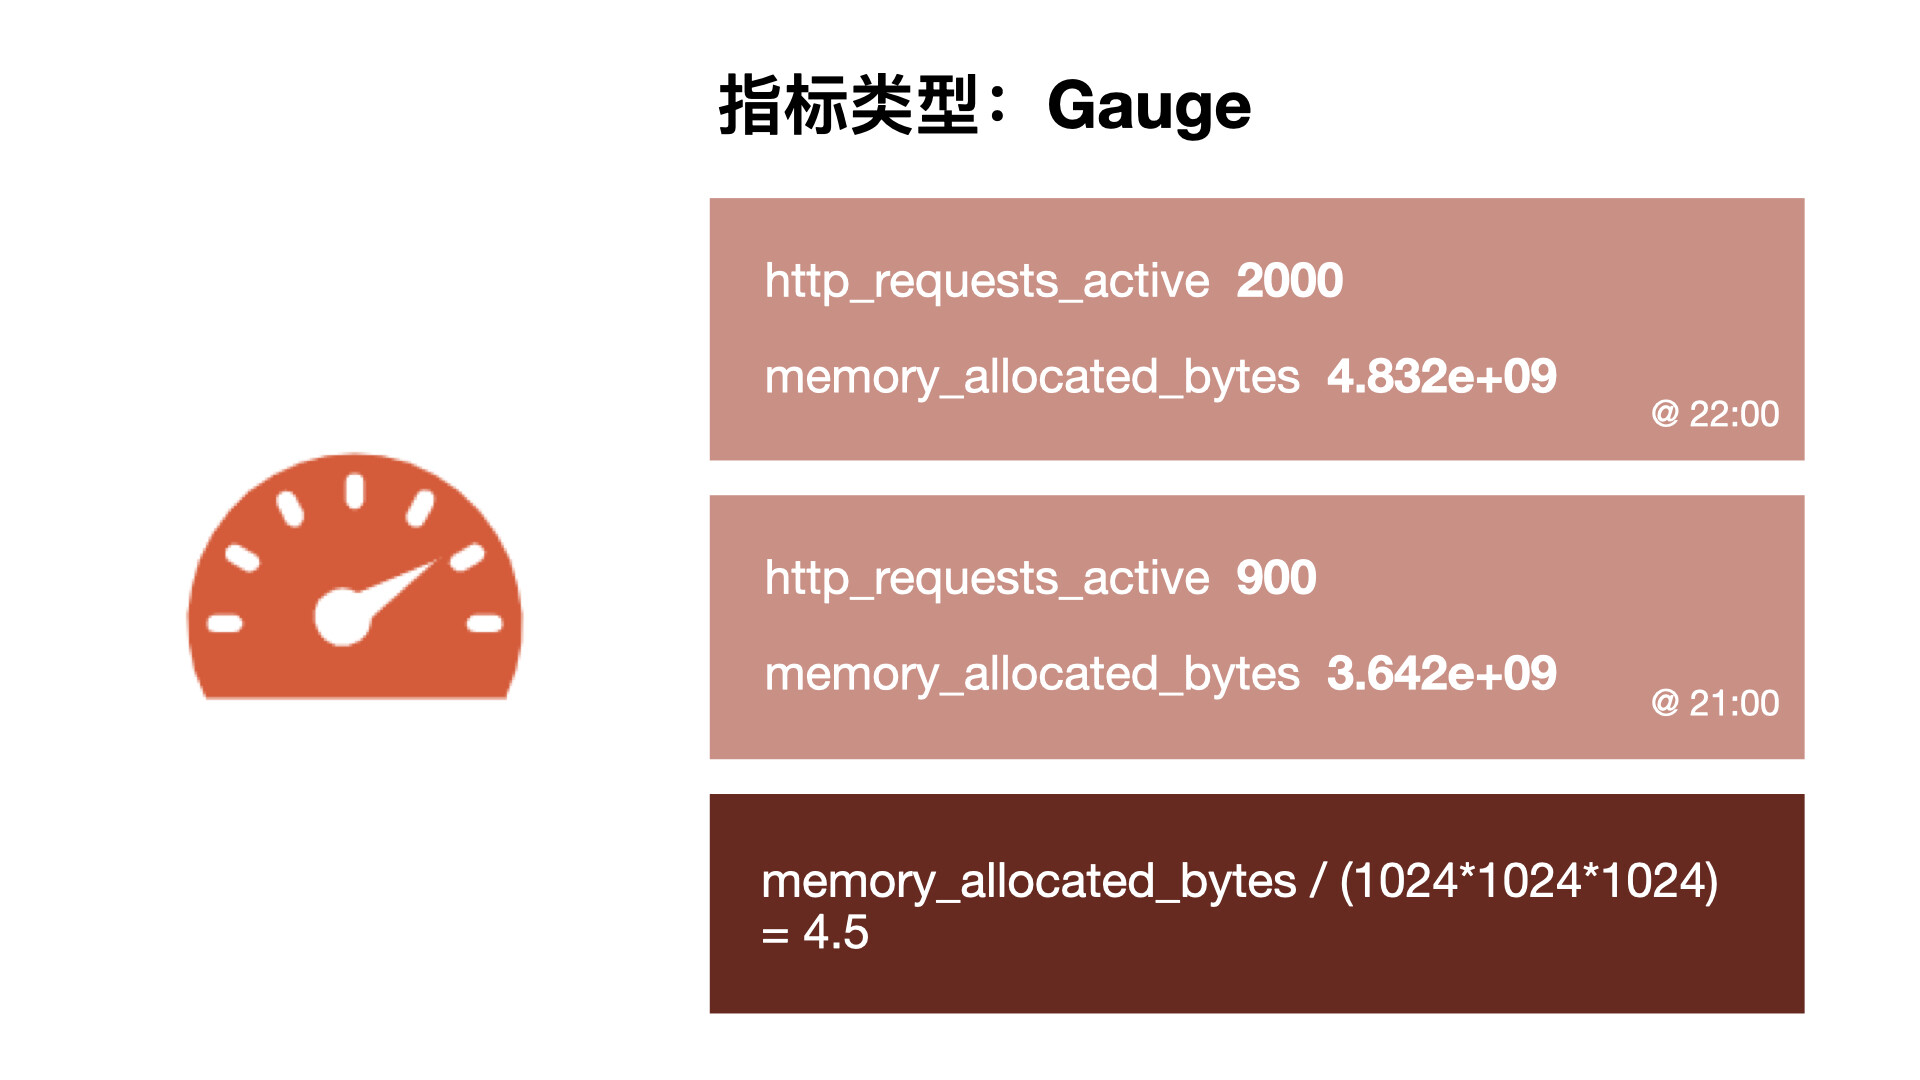
2.7.2 Gauge
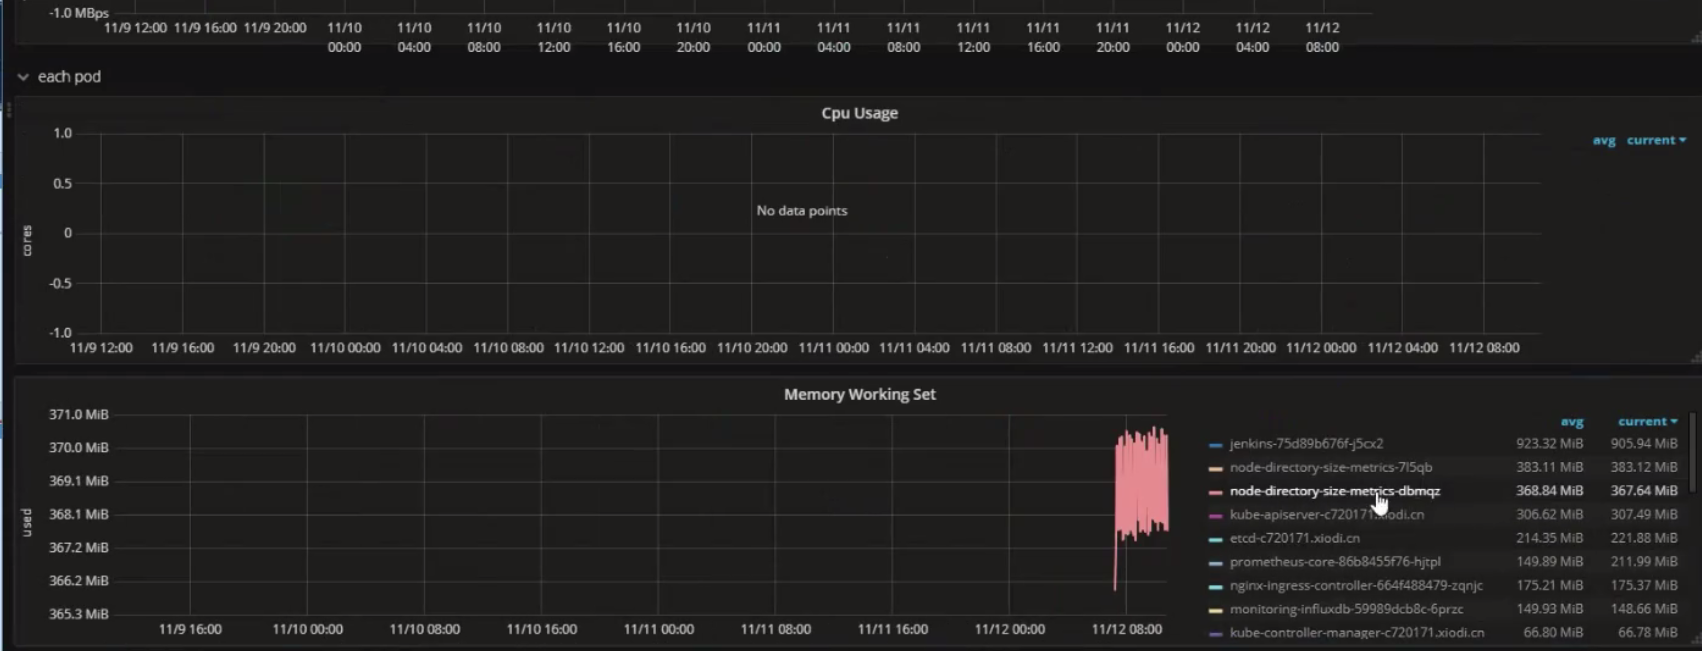
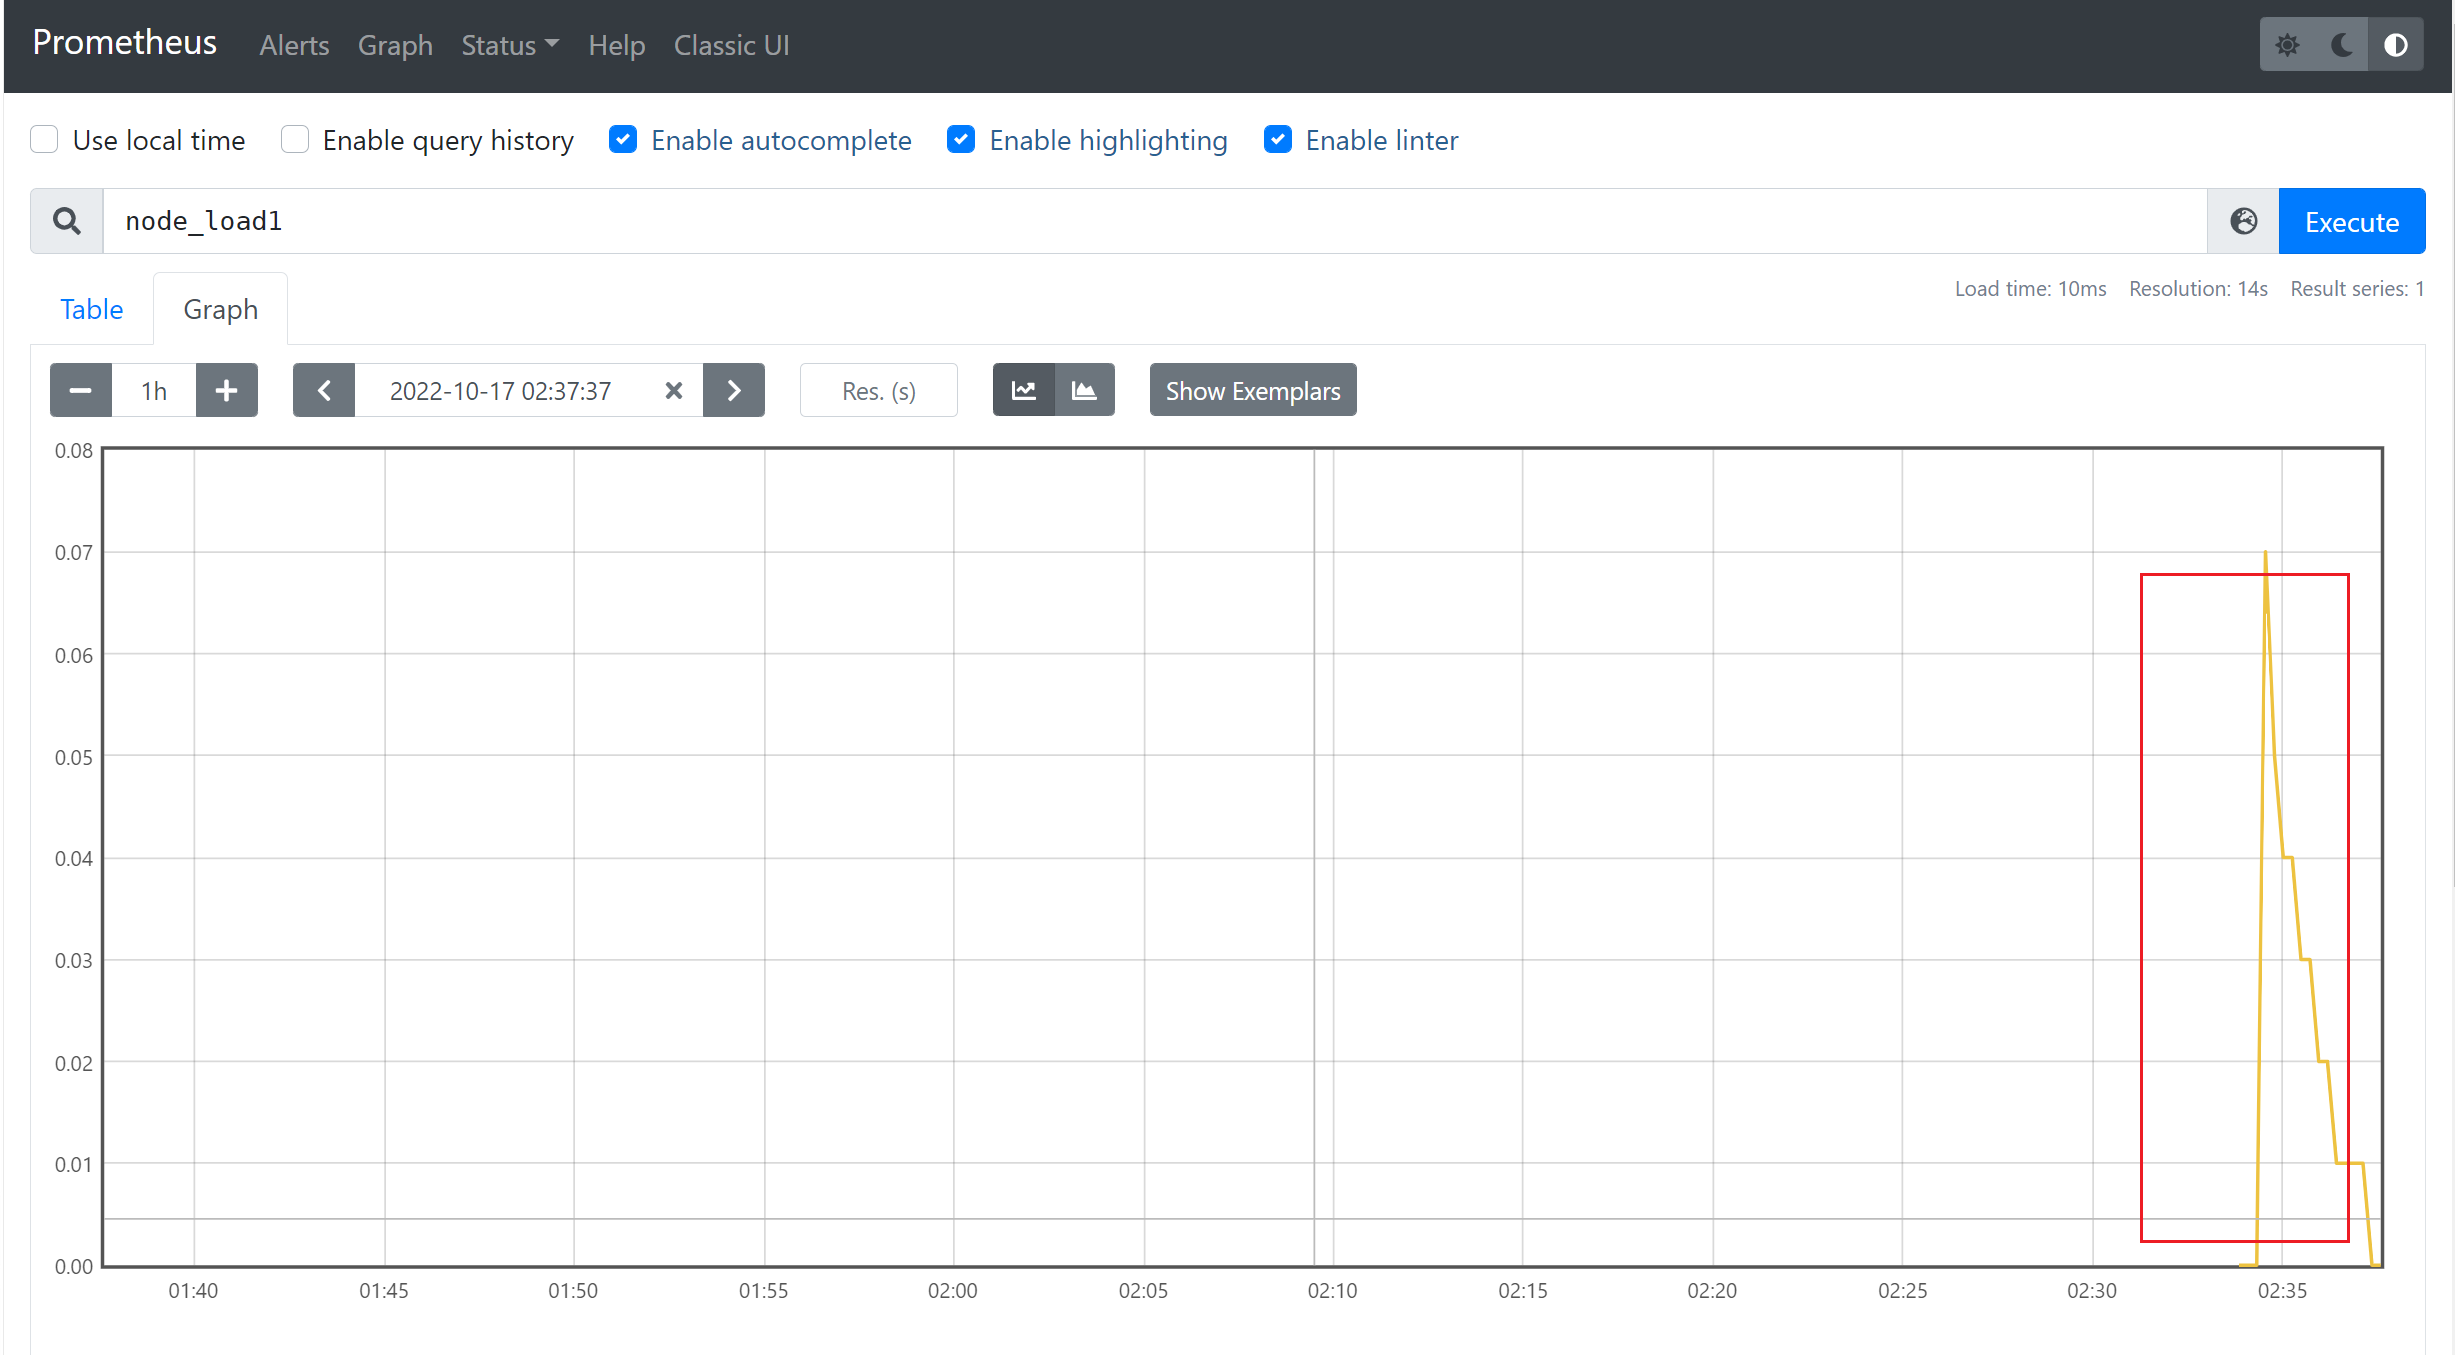
与 Counter 不同,Gauge(可增可减的仪表盘)类型的指标侧重于反应系统的当前状态,因此这类指标的样本数据可增可减。常见指标如 node_memory_MemFree_bytes(当前主机空闲的内存大小)、node_memory_MemAvailable_bytes(可用内存大小)都是 Gauge 类型的监控指标。由于 Gauge 指标仍然带有时间戳存储,所有我们可以看到随时间变化的值,通常可以直接把它们绘制出来,这样就可以看到值本身而不是变化率了,通过 Gauge 指标,用户可以直接查看系统的当前状态。
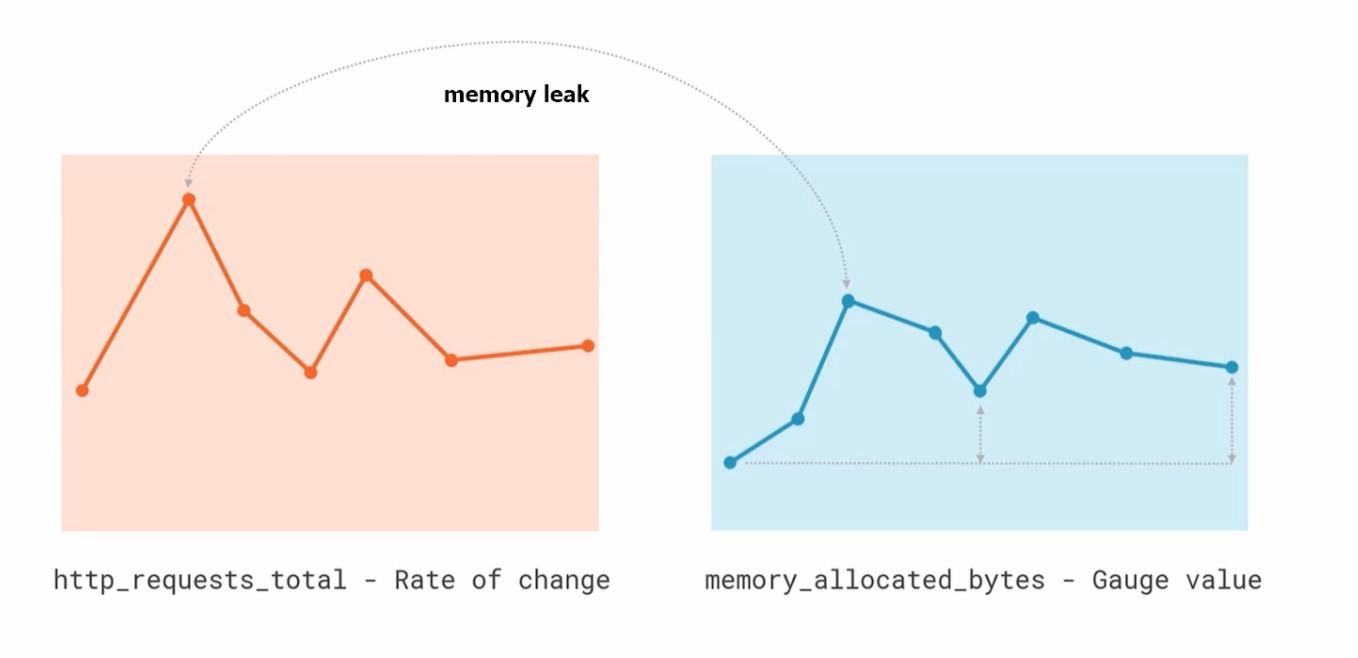
这些简单的指标类型都只是为每个样本获取一个数字,但 Prometheus 的强大之处在于如何让你跟踪它们,比如我们绘制了两张图,一个是 HTTP 请求的变化率,另一个是分配的 gauge 类型的实际内存,直接从图上就可以看出这两个之间有一种关联性,当请求出现峰值的时候,内存的使用也会出现峰值,但是我们仔细观察也会发现在峰值过后,内存使用量并没有恢复到峰值前的水平,整体上它在逐渐增加,这表明很可能应用程序中存在内存泄露的问题,通过这些简单的指标就可以帮助我们找到这些可能存在的问题。
对于 Gauge 类型的监控指标,通过 PromQL 内置函数 delta() 可以获取样本在一段时间范围内的变化情况。例如,计算 CPU 温度在两个小时内的差异:
delta(cpu_temp_celsius{host="zeus"}[2h])
还可以直接使用 predict_linear() 对数据的变化趋势进行预测。例如,预测系统磁盘空间在 4 个小时之后的剩余情况:
predict_linear(node_filesystem_free_bytes[1h], 4 * 3600)
2.7.3 Histogram 和 Summary
除了 Counter 和 Gauge 类型的监控指标以外,Prometheus 还定义了 Histogram 和 Summary 的指标类型。Histogram 和 Summary 主用用于统计和分析样本的分布情况。
在大多数情况下人们都倾向于使用某些量化指标的平均值,例如 CPU 的平均使用率、页面的平均响应时间,这种方式也有很明显的问题,以系统 API 调用的平均响应时间为例:如果大多数 API 请求都维持在 100ms 的响应时间范围内,而个别请求的响应时间需要 5s,那么就会导致某些 WEB 页面的响应时间落到中位数上,而这种现象被称为长尾问题。
为了区分是平均的慢还是长尾的慢,最简单的方式就是按照请求延迟的范围进行分组。例如,统计延迟在 0~10ms 之间的请求数有多少而 10~20ms 之间的请求数又有多少。通过这种方式可以快速分析系统慢的原因。Histogram 和 Summary 都是为了能够解决这样的问题存在的,通过 Histogram 和 Summary 类型的监控指标,我们可以快速了解监控样本的分布情况。
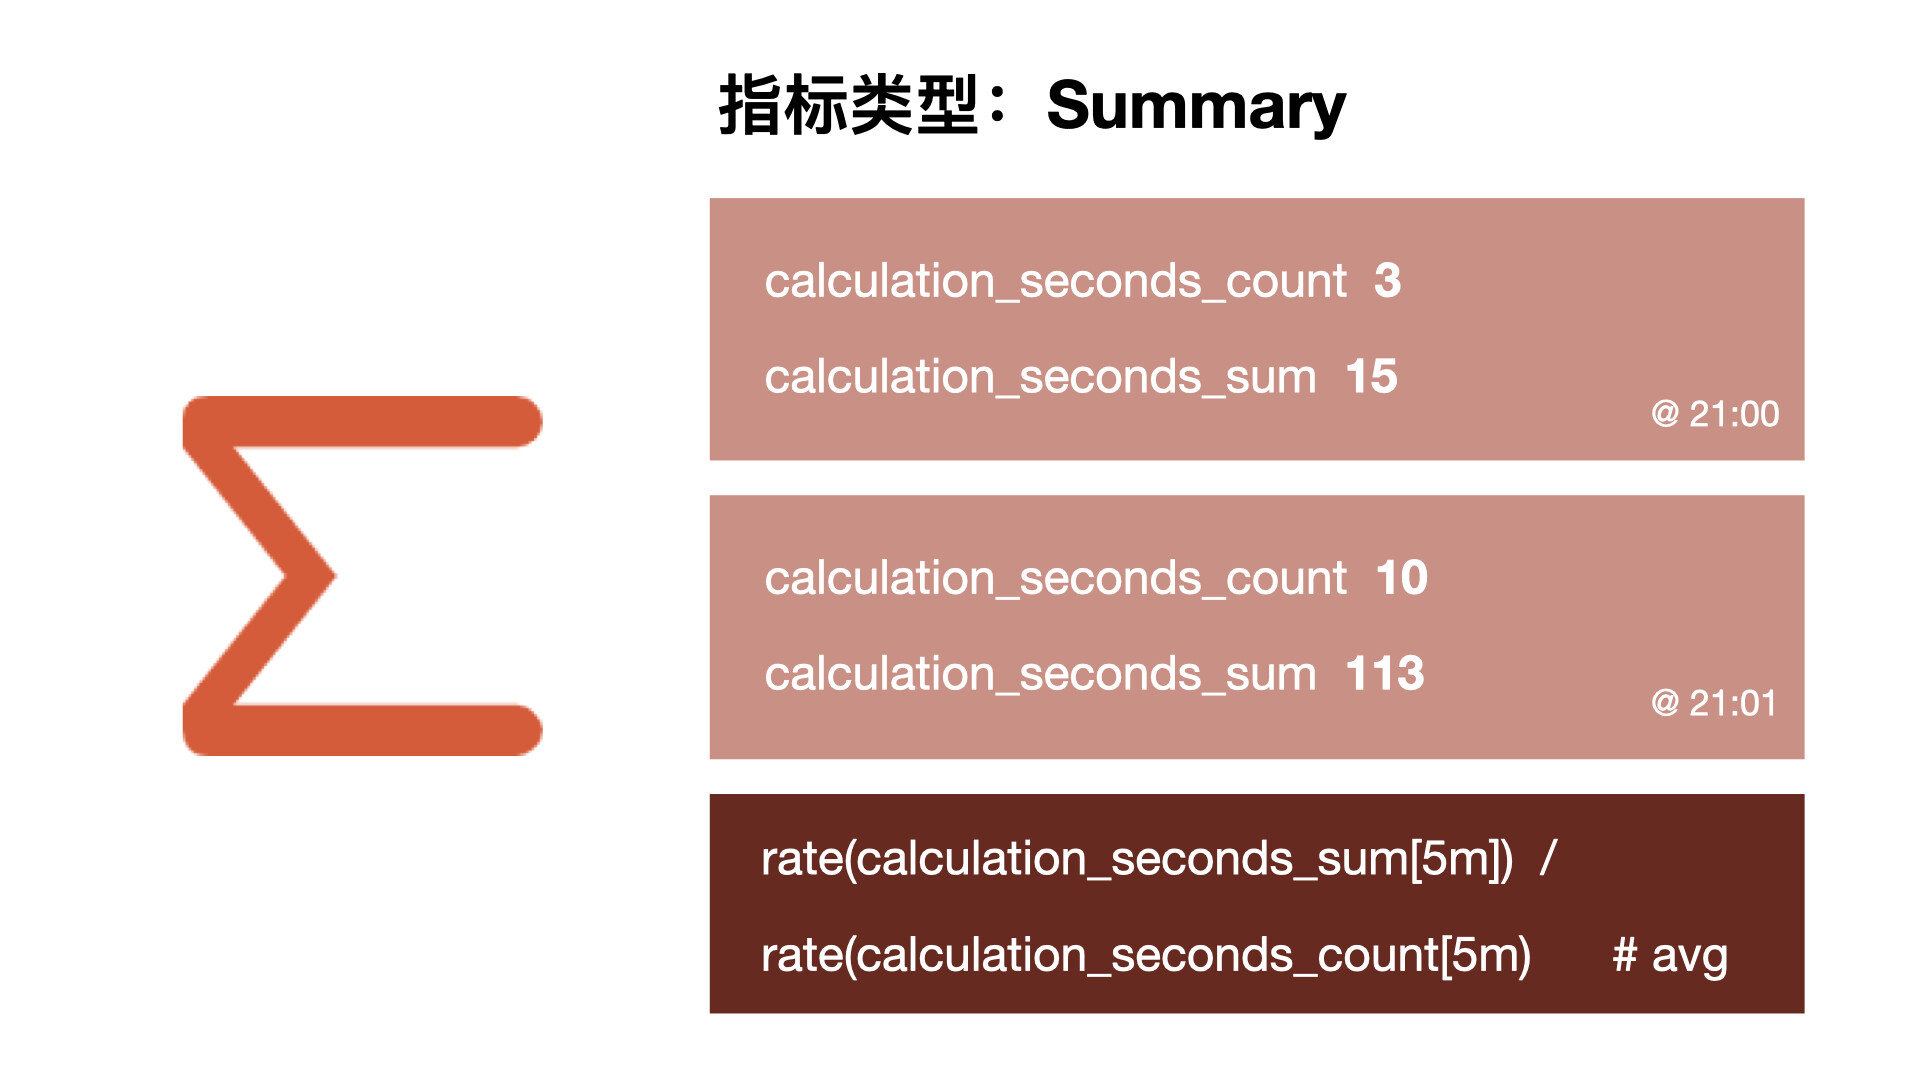
Summary
摘要用于记录某些东西的平均大小,可能是计算所需的时间或处理的文件大小,摘要显示两个相关的信息:count(事件发生的次数)和 sum(所有事件的总大小),如下图计算摘要指标可以返回次数为 3 和总和 15,也就意味着 3 次计算总共需要 15s 来处理,平均每次计算需要花费 5s。下一个样本的次数为 10,总和为 113,那么平均值为 11.3,因为两组指标都记录有时间戳,所以我们可以使用摘要来构建一个图表,显示平均值的变化率,比如图上的语句表示的是 5 分钟时间段内的平均速率。
例如,指标 prometheus_tsdb_wal_fsync_duration_seconds 的指标类型为 Summary,它记录了 Prometheus Server 中 wal_fsync 的处理时间,通过访问 Prometheus Server 的 /metrics 地址,可以获取到以下监控样本数据:
# HELP prometheus_tsdb_wal_fsync_duration_seconds Duration of WAL fsync.
# TYPE prometheus_tsdb_wal_fsync_duration_seconds summary
prometheus_tsdb_wal_fsync_duration_seconds{quantile="0.5"} 0.012352463
prometheus_tsdb_wal_fsync_duration_seconds{quantile="0.9"} 0.014458005
prometheus_tsdb_wal_fsync_duration_seconds{quantile="0.99"} 0.017316173
prometheus_tsdb_wal_fsync_duration_seconds_sum 2.888716127000002
prometheus_tsdb_wal_fsync_duration_seconds_count 216
从上面的样本中可以得知当前 Prometheus Server 进行 wal_fsync 操作的总次数为 216 次,耗时 2.888716127000002s。其中中位数(quantile=0.5)的耗时为 0.012352463,9 分位数(quantile=0.9)的耗时为 0.014458005s。
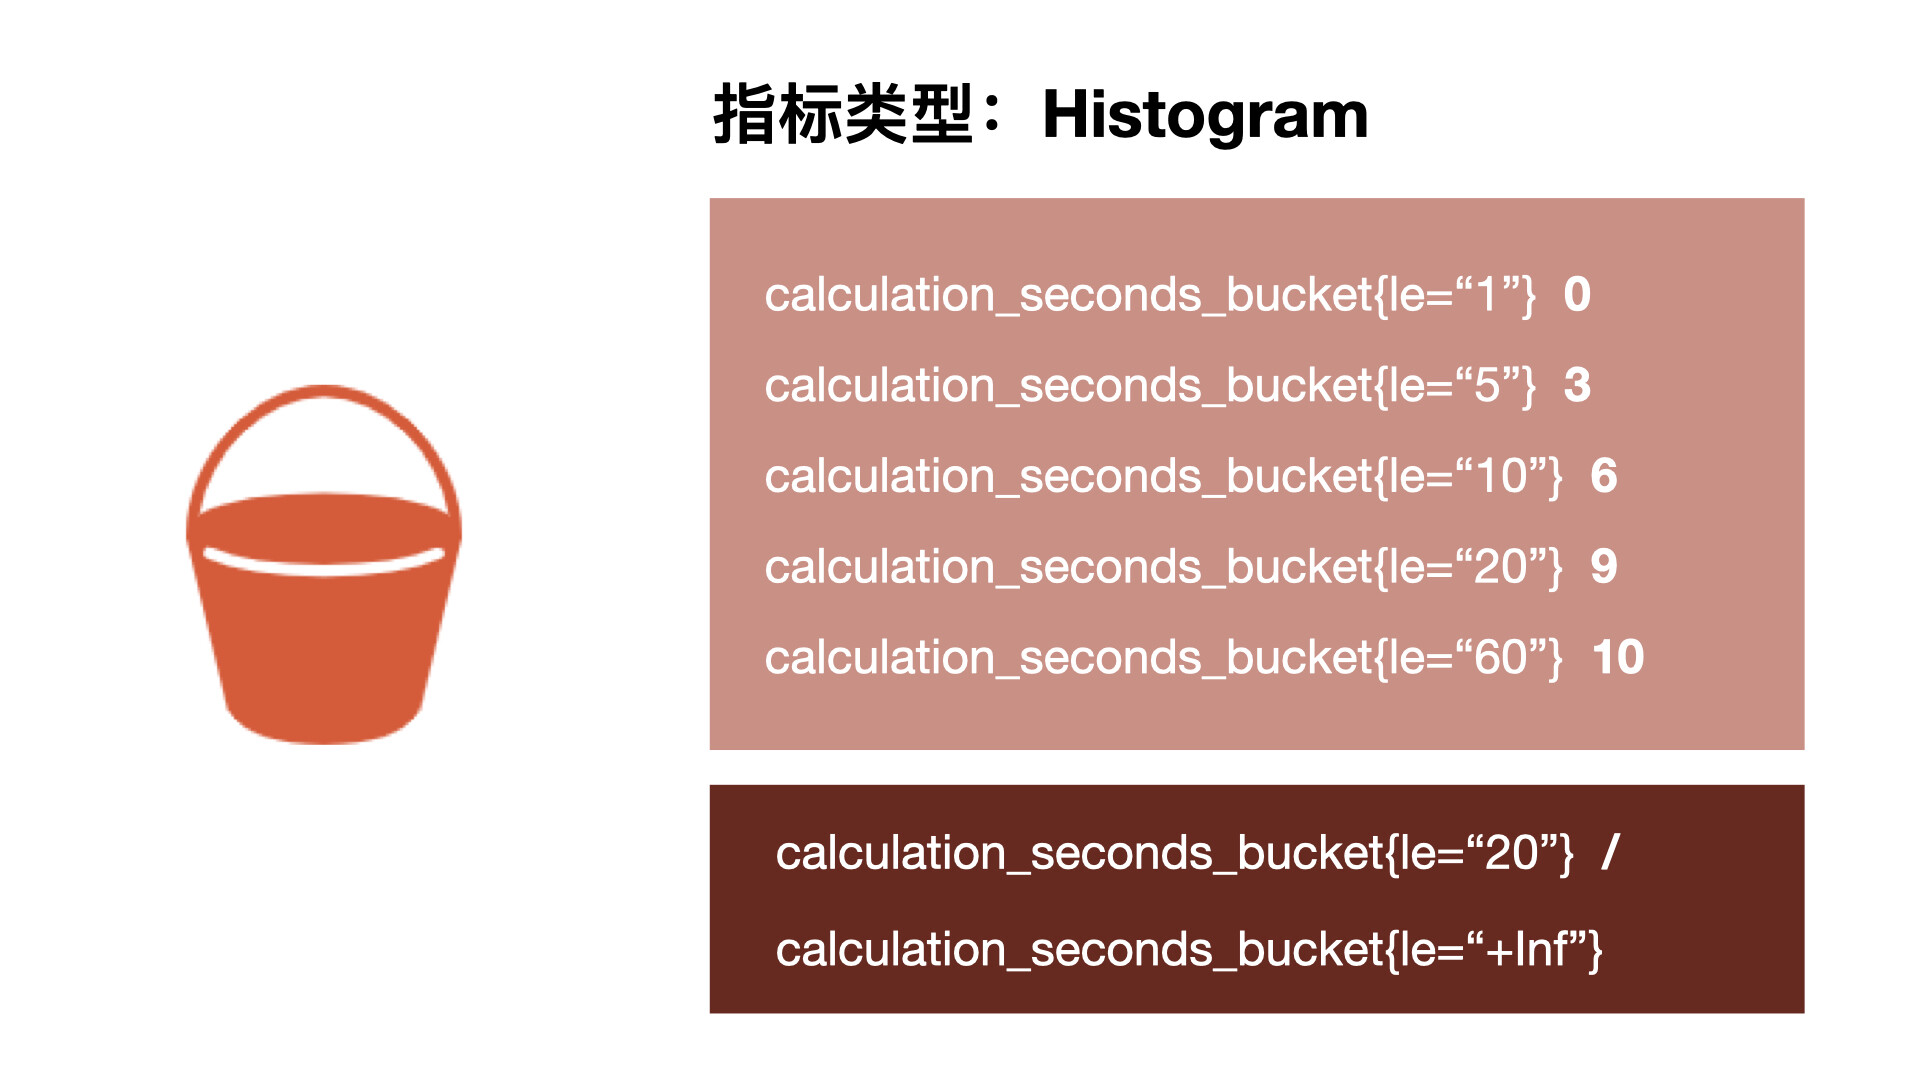
Histogram
摘要非常有用,但是平均值会隐藏一些细节,上图中 10 与 113 的总和包含非常广的范围,如果我们想查看时间花在什么地方了,那么我们就需要直方图了。直方图以 bucket 桶的形式记录数据,所以我们可能有一个桶用于需要 1s 或更少的计算,另一个桶用于 5 秒或更少、10 秒或更少、20 秒或更少、60 秒或更少。该指标返回每个存储桶的计数,其中 3 个在 5 秒或更短的时间内完成,6 个在 10 秒或更短的时间内完成。Prometheus 中的直方图是累积的,因此所有 10 次计算都属于 60 秒或更少的时间段,而在这 10 次中,有 9 次的处理时间为 20 秒或更少,这显示了数据的分布。所以可以看到我们的大部分计算都在 10 秒以下,只有一个超过 20 秒,这对于计算百分位数很有用。
在 Prometheus Server 自身返回的样本数据中,我们也能找到类型为 Histogram 的监控指标 prometheus_tsdb_compaction_chunk_range_seconds_bucket:
# HELP prometheus_tsdb_compaction_chunk_range_seconds Final time range of chunks on their first compaction
# TYPE prometheus_tsdb_compaction_chunk_range_seconds histogram
prometheus_tsdb_compaction_chunk_range_seconds_bucket{le="100"} 71
prometheus_tsdb_compaction_chunk_range_seconds_bucket{le="400"} 71
prometheus_tsdb_compaction_chunk_range_seconds_bucket{le="1600"} 71
prometheus_tsdb_compaction_chunk_range_seconds_bucket{le="6400"} 71
prometheus_tsdb_compaction_chunk_range_seconds_bucket{le="25600"} 405
prometheus_tsdb_compaction_chunk_range_seconds_bucket{le="102400"} 25690
prometheus_tsdb_compaction_chunk_range_seconds_bucket{le="409600"} 71863
prometheus_tsdb_compaction_chunk_range_seconds_bucket{le="1.6384e+06"} 115928
prometheus_tsdb_compaction_chunk_range_seconds_bucket{le="6.5536e+06"} 2.5687892e+07
prometheus_tsdb_compaction_chunk_range_seconds_bucket{le="2.62144e+07"} 2.5687896e+07
prometheus_tsdb_compaction_chunk_range_seconds_bucket{le="+Inf"} 2.5687896e+07
prometheus_tsdb_compaction_chunk_range_seconds_sum 4.7728699529576e+13
prometheus_tsdb_compaction_chunk_range_seconds_count 2.5687896e+07
与 Summary 类型的指标相似之处在于 Histogram 类型的样本同样会反应当前指标的记录的总数(以 _count 作为后缀)以及其值的总量(以 _sum 作为后缀)。不同在于 Histogram 指标直接反应了在不同区间内样本的个数,区间通过标签 le 进行定义
2.8 数据采集方式
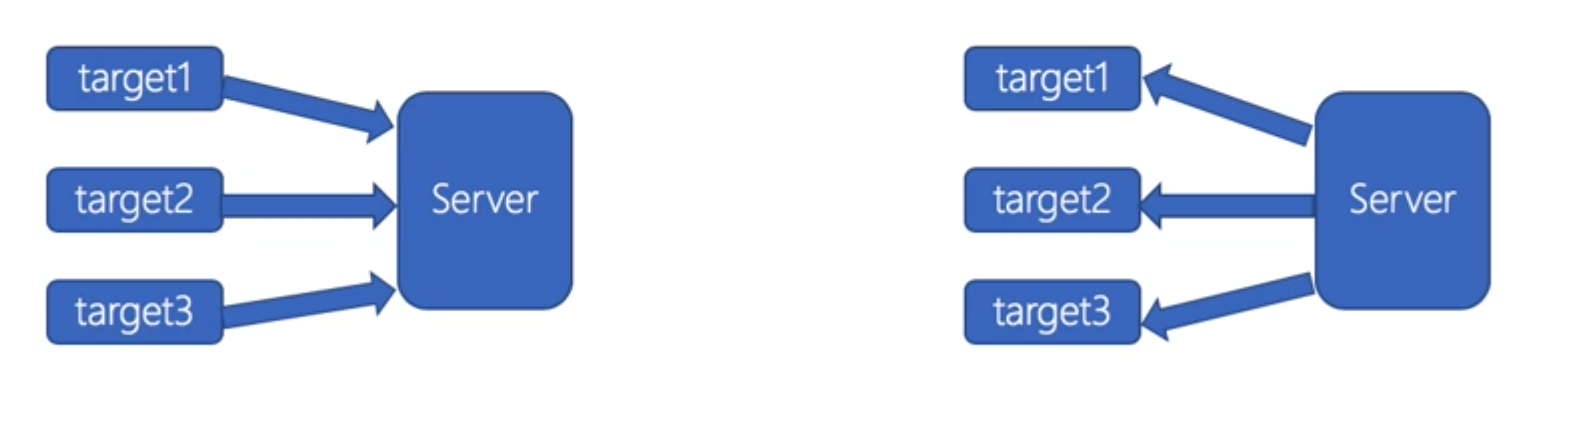
prometheus数据采集有2种方式,prometheus采用的pull方式。
1)push

target主动将数据推给server

2)pull

server主动去拉取target的数据
拉取数据的特点

 pull方式:

1)实时性:

     通过周期性的采集,设置采集时间,实时性不如push的方式

2)状态保存

    target需要数据存储能力,server只负责数据拉取

    server可以做到无状态-http

3)控制能力

   server更加主动,控制采集的内容和采集的频率

4)配置的复杂性

     通过批量配置或者自动发现来获取所有采集点

     相对简单,可以做到target充分解耦,无需感知server的存在


push 方式

1)实时性:

相对较好,可以采集数据立即上报到监控中心

2)状态保存

  采集完数据后立即上报,本地不会保存采集的数据

  target本身是无状态,server需要维护各种target的状态

3)控制能力

  控制方为target,target决定了上报数据的周期和内容

4)配置的复杂性

  每个target都需要配置server的地址
2.9 数据存储
Promtheus支持本地存储时间序列数据,也支持远程存储
时序数据库:http://opentsdb.net/docs/build/html/index.html
Prometheus采用的是时间序列的方式以一种自定义的格式存储在本地硬盘上
Prometheus的本地时间序列数据库以每2h为间隔来分block(块)存储,每一个块中又分为多个chunk文件,chunk文件是用来存放时间序列数据、metadata和索引index
index文件是对metric(prometheus中一次K/V采集数据叫做一个metric)和label(标签)进行索引之后存储在chunk中 chunk是作为存储的基本单位,index and metadata作为子集
prometheus平时是将采集的数据先存放在内存中(prometheus对内存的消耗,还是比较小的),以类似缓存的方式用于加速搜索和快速访问
当出现宕机时,prometheus有一种保护机制叫做WAL,可以将数据定期存入硬盘中chunk来表示。并在重新启动时用于恢复进入内存
2.9.1 数据存储格式
prmetheus基本上将所有数据存储为时间序列

metric命名格式要求:[a-zA-Z_:][a-zA-Z0-9_:]* ,Label 格式要求 [a-zA-Z_][a-zA-Z0-9_]并以_开头的label是内部使用的。Label的value为空的Label被认为是和不存在该Label的
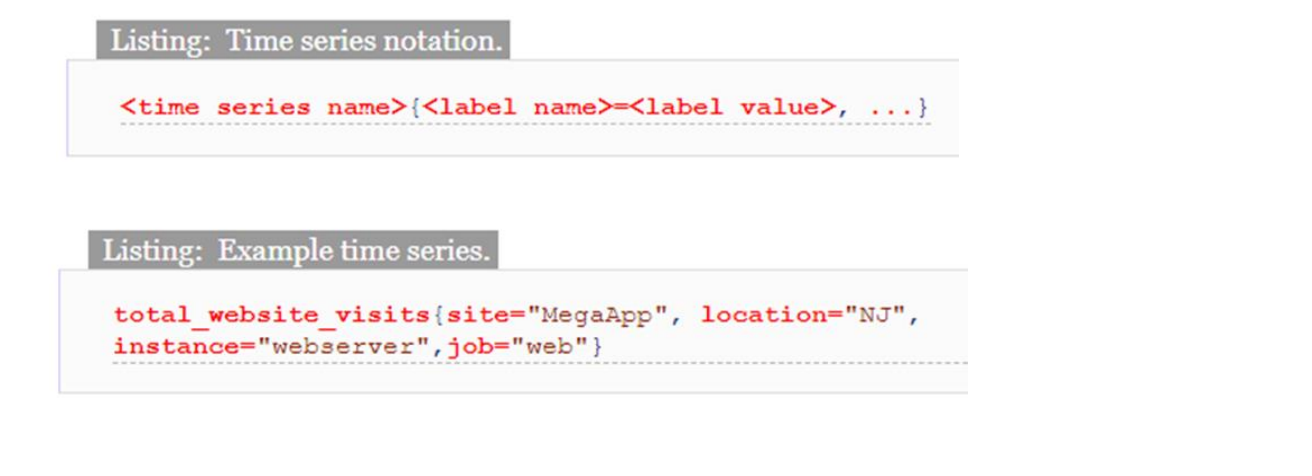
时间序列的表示格式:
<metric name>{<label name>=<label value>, ...}      #metric_name对应多个label,不通label的结合对应不同的value

#举例
api_http_requests_total{method="POST", handler="/messages"}
2.9.2 本地存储数据
可以存储在本地,也可以存储到远程系统上
[root@prometheus data]# ll
总用量 20
drwxr-xr-x 3  700 root    68 5月  30 21:02 01F6YNX0G290KVDSW5B0CV9F9N
drwxr-xr-x 3  700 root    68 6月   4 09:34 01F7AAGYNM9WJVQWEE76C3C4S3
drwxr-xr-x 3  700 root    68 6月   4 13:01 01F7APBV7124ZZXEDH0WFXNVBF
drwxr-xr-x 3  700 root    68 6月   4 19:00 01F7BAWAD1RMETVR2QJ7JR2C15
drwxr-xr-x 3  700 root    68 6月   7 11:12 01F7J79JZSQ4DZ393TZXRZ5HBA
drwxr-xr-x 3  700 root    68 6月   7 13:14 01F7JE8ZGWA0R0BNG87C8AMSSR
drwxr-xr-x 3  700 root    68 6月   7 19:00 01F7K22E6PDT4A5JTRXYV1QYE9
drwxr-xr-x 3 root root    68 6月   8 13:00 01F7MZVZAW0H7VBQV296FNKRGE
drwxr-xr-x 3 root root    68 6月   9 13:00 01F7QJ8PAVAJE5W4M5MW4QW2M2
drwxr-xr-x 3 root root    68 6月  10 01:00 01F7RVF1Y9CPN51HYDE5K3AW5K
drwxr-xr-x 3 root root    68 6月  13 15:19 01F823SWE6G0WV1K2WK0DQ34FP
drwxr-xr-x 3 root root    68 6月  13 15:19 01F823SWHHRDHM4MMP6WKKB0D3
drwxr-xr-x 3 root root    68 6月  13 15:19 01F823SWMH6HH1SQ8YKBV8399R
drwxr-xr-x 2  700 root    20 6月  13 16:00 chunks_head
-rw-r--r-- 1  700 root     0 5月  29 14:33 lock
-rw-r--r-- 1  700 root 20001 6月  13 16:05 queries.active
drwxr-xr-x 3  700 root    81 6月  13 15:31 wal

[root@prometheus data]# cd  01F823SWMH6HH1SQ8YKBV8399R
[root@prometheus 01F823SWMH6HH1SQ8YKBV8399R]# ll
总用量 396
drwxr-xr-x 2 root root     20 6月  13 15:19 chunks
-rw-r--r-- 1 root root 395834 6月  13 15:19 index
-rw-r--r-- 1 root root    700 6月  13 15:19 meta.json
-rw-r--r-- 1 root root      9 6月  13 15:19 tombstones
[root@prometheus 01F823SWMH6HH1SQ8YKBV8399R]# ls chunks/
000001
[root@prometheus 01F823SWMH6HH1SQ8YKBV8399R]# ls chunks/000001
chunks/000001
说明:
默认每2h生成一个chunk子目录,目录内包含一个chunks子目录,该子目录包含该时间窗口的所有时间序列样本,一个元数据文件和一个索引文件(该索引文件将度量名称和标签索引到chunks目录中的时间序列)。chunks目录中的样本被组合到一个或多个段文件中,每个段文件的默认大小为512MB。当通过API删除序列时,删除记录存储在单独的tombstone文件中(而不是立即从块段中删除数据)。
近期数据的current block是保存在内存中的。通过WAL(write-ahead-log)来防止崩溃。可以在prometheus崩溃后重启replay使用。WAL日志存储在wal目录中,每128MB一个分片,这些文件中保存尚未压缩的原始数据。prometheus将保留至少3个wal文件
注意:
	1.由于本地local-storage么有集群和复制功能。建议底层使用raid。备份时建议使用快照
	2.外部存储可以通过 remote read/write api,但是性能和效率差异会很大


相关参数:

prometheus通过以下选项来配置本地存储。

--storage.tsdb.path:数据存储位置,默认是data目录。

--storage.tsdb.retention.time:保留时间,默认是15天,过15天之后,就删除。该配置会覆盖--storage.tsdb.retention的值。

--storage.tsdb.retention.size:要保留的块的最大字节数。最早的数据会首先被删除。默认为0或禁用。

磁盘的最小尺寸取决于:wal目录(wal和checkpoint)和chunks_head目录(m-mapped head chunks)的峰值空间(每2小时会达到一次峰值)。

 --storage.tsdb.wal-compression:开启预写日志的压缩。
2.9.3 远程存储
prometheus集成远程存储的三种方式:
(1)prometheus会将它接收的样本数据以标准格式写入远程的URL。

(2)prometheus能从其他prometheus服务器以标准格式接收样本数据。

(3)prometheus以标准格式从远程URL读取样本数据。


对应参数:--storage.remote.*
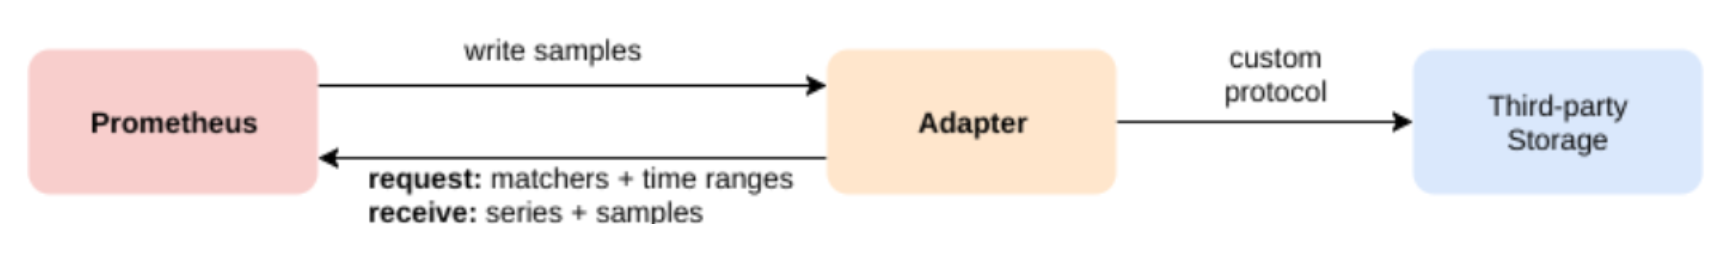
Prometheus提供了remote_write和remote_read的特性,支持将数据存储到远端和从远端读取数据的功能。当配置remote_write特性后,Prometheus会将采集到的指标数据通过HTTP的形式发送给适配器(Adaptor),由适配器进行数据的存入。而remote_read特性则会向适配器发起查询请求,适配器根据请求条件从第三方存储服务中获取响应的数据。
2.10 prometheus的工作流程
1. Prometheus server 可定期从活跃的(up) 目标主机上 (target)拉取监控指标数据,目标主机的监控数据可通过配置静态 job 或者服务发现的方式被 prometheus server 采集到,这种方式默认的pull 方式拉取指标;也可通过 pushgateway 把采集的数据上报prometheus server 中,还可通过一些组件自带的exporter 采集相应组件的数据;
2.Prometheus server 把采集到的监控指标数据保存到本地磁盘或者数据库;
3.Prometheus 采集的监控指标数据按时间序列存储,通过配置报警规则,把触发的报警发送到alertmanagert
4.Alertmanager 通过配置报警接收方,发送报警到邮件,微信或者钉钉等。
5.Prometheus 自带的 web ui 界面提供 PromQL 查询语言,可查询监控数据
6.Grafana 可接入 prometheus 数据源,把监控数据以图形化形式展示出
三、部署prometheus
部署前准备:
1、保证服务器能上网

2、关闭防火墙和selinux

3、时间同步
timedatectl set-ntp true					#开启 NTP
timedatectl set-timezone Asia/Shanghai		#设置时区
chronyc -a makestep							#强制同步下系统时钟
timedatectl status							#查看时间同步状态
chronyc sources -v							#查看 ntp 源服务器信息
timedatectl set-local-rtc 0					#将当前的UTC时间写入硬件时钟
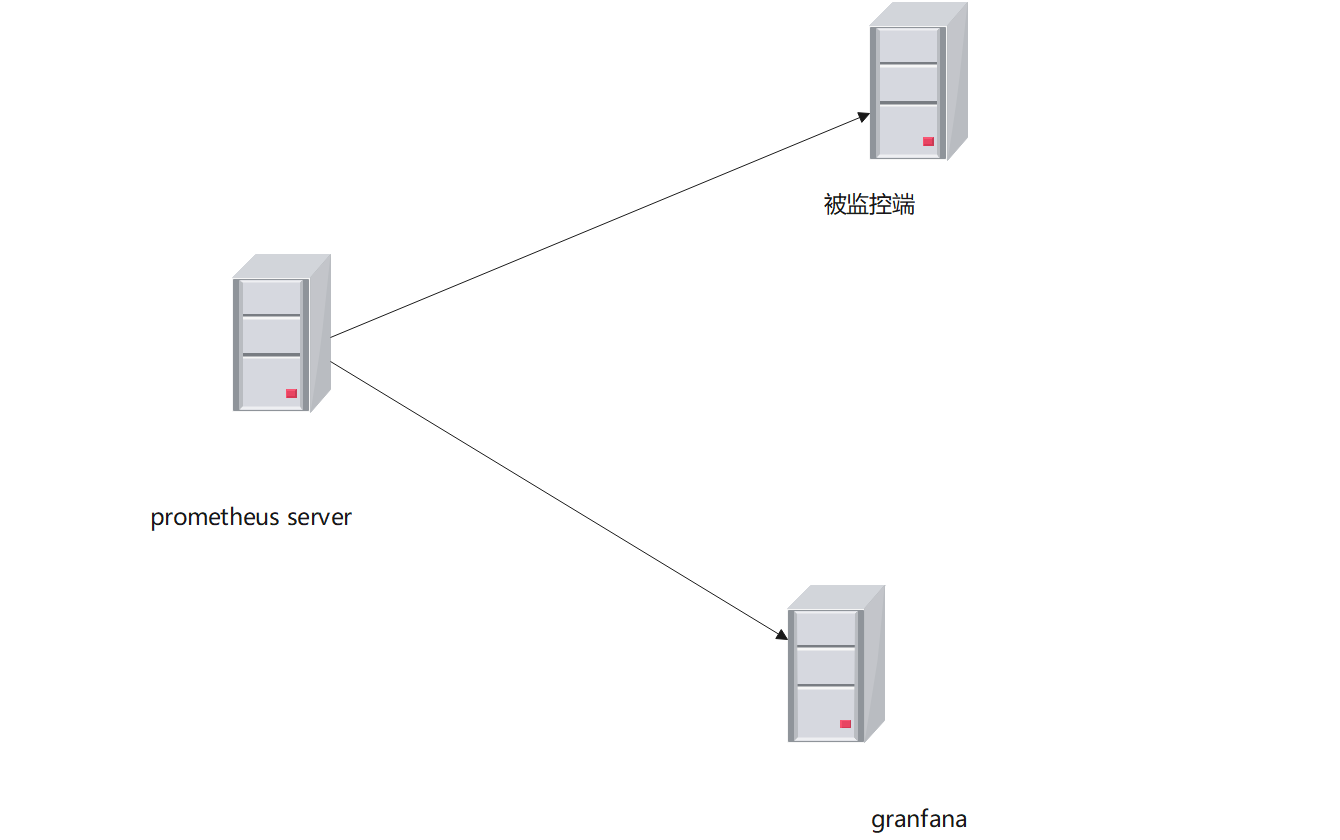
ip地址规划
192.168.1.100    prometheus-server
192.168.1.102    node_exporter
192.168.1.104    grafana
3.1 安装prometheus
3.1.1 先在prometheus的官方下载安装软件包
https://prometheus.io/download/
3.1.2 安装prometheus server
##创建安装目录
[root@prometheus-server prometheus]# mkdir /usr/local/prometheus
##解压
[root@prometheus-server prometheus]# tar zxvf prometheus-2.32.1.linux-amd64.tar.gz -C /usr/local/prometheus
prometheus-2.32.1.linux-amd64/
prometheus-2.32.1.linux-amd64/consoles/
prometheus-2.32.1.linux-amd64/consoles/index.html.example
prometheus-2.32.1.linux-amd64/consoles/node-cpu.html
prometheus-2.32.1.linux-amd64/consoles/node-disk.html
prometheus-2.32.1.linux-amd64/consoles/node-overview.html
prometheus-2.32.1.linux-amd64/consoles/node.html
prometheus-2.32.1.linux-amd64/consoles/prometheus-overview.html
prometheus-2.32.1.linux-amd64/consoles/prometheus.html
prometheus-2.32.1.linux-amd64/console_libraries/
prometheus-2.32.1.linux-amd64/console_libraries/menu.lib
prometheus-2.32.1.linux-amd64/console_libraries/prom.lib
prometheus-2.32.1.linux-amd64/prometheus.yml
prometheus-2.32.1.linux-amd64/LICENSE
prometheus-2.32.1.linux-amd64/NOTICE
prometheus-2.32.1.linux-amd64/prometheus
prometheus-2.32.1.linux-amd64/promtool
[root@prometheus-server prometheus]#
3.1.3 将系统启动命令加入到系统环境中
将prometheus-2.32.1.linux-amd64/prometheus和prometheus-2.32.1.linux-amd64/promtool两个执行文件复制到系统环境的路径下,使之可以调用系统环境
[root@prometheus-server prometheus]# cp prometheus-2.32.1.linux-amd64/{prometheus,promtool} /usr/local/bin/
3.1.4 测试
[root@prometheus-server prometheus]# prometheus --version
prometheus, version 2.32.1 (branch: HEAD, revision: 41f1a8125e664985dd30674e5bdf6b683eff5d32)
  build user:       root@54b6dbd48b97
  build date:       20211217-22:08:06
  go version:       go1.17.5
  platform:         linux/amd64
[root@prometheus-server prometheus]#
3.1.5 创建prometheus的配置文件
[root@prometheus-server prometheus-2.32.1.linux-amd64]# cp prometheus.yml prometheus.yml.old
[root@prometheus-server prometheus-2.32.1.linux-amd64]# mkdir /etc/prometheus -p
[root@prometheus-server prometheus-2.32.1.linux-amd64]# cp prometheus.yml /etc/prometheus/
3.1.6 启动prometheus
##检查配置
[root@prometheus-server prometheus-2.32.1.linux-amd64]#  promtool check config /etc/prometheus/prometheus.yml
Checking /etc/prometheus/prometheus.yml
  SUCCESS: 0 rule files found

##启动
[root@prometheus-server prometheus-2.32.1.linux-amd64]# prometheus --config.file "/etc/prometheus/prometheus.yml"
3.1.7 访问测试
http://ip:9090
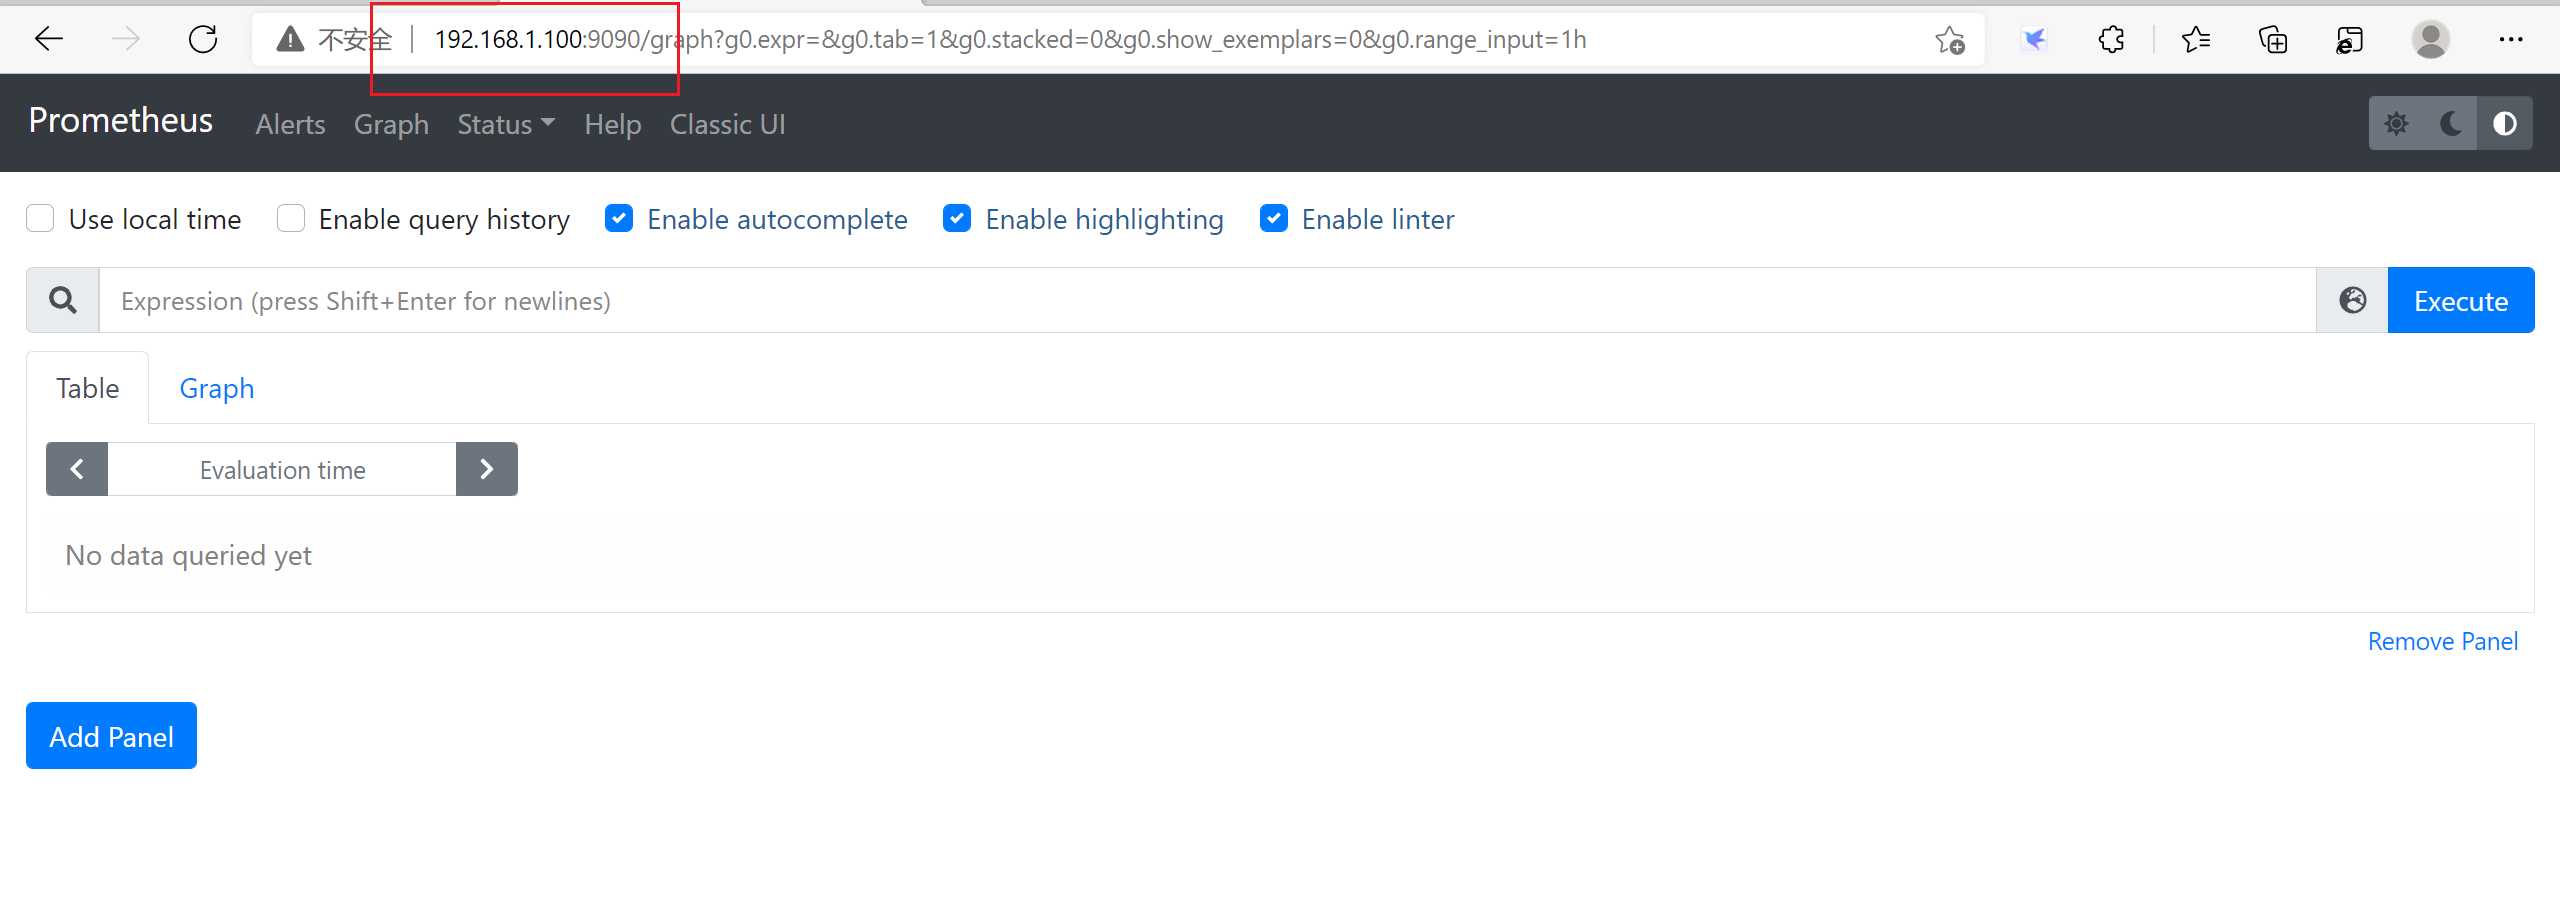
3.1.8 数据查看
3.2 通过 docker 安装
# wget -O /etc/yum.repos.d/docker-ce.repo https://mirrors.aliyun.com/docker-ce/linux/centos/docker-ce.repo
# docker run -d -p 9090:9090 prom/prometheus
# docker run -d -p 9090:9090 -v /tmp/prometheus.yml:/etc/prometheus/prometheus.yml prom/prometheus
热配置:
curl -X POST http://localdns:9090/-/reload //热载入配置,2.0之后,默认是关闭的,需要 --web.enable-lifecycle
参数 开启
kill -HUP pid
3.3 安装监控节点
3.3.1 解压node_exporter
[root@node ~]#  mkdir /usr/local/node_exporter
[root@node ~]# tar zxvf node_exporter-1.3.1.linux-amd64.tar.gz -C /usr/local/node_exporter
node_exporter-1.3.1.linux-amd64/
node_exporter-1.3.1.linux-amd64/LICENSE
node_exporter-1.3.1.linux-amd64/NOTICE
node_exporter-1.3.1.linux-amd64/node_exporter
3.3.2 复制执行脚本到系统环境变量路径中
[root@node ~]# cp /usr/local/node_exporter/node_exporter-1.3.1.linux-amd64/node_exporter /usr/local/bin/
3.3.3 查看版本
[root@node ~]# node_exporter --version
node_exporter, version 1.3.1 (branch: HEAD, revision: a2321e7b940ddcff26873612bccdf7cd4c42b6b6)
  build user:       root@243aafa5525c
  build date:       20211205-11:09:49
  go version:       go1.17.3
  platform:         linux/amd64
3.3.4 运行node_exporter
[root@node ~]# nohup node_exporter&
3.3.5 查看服务的端口
[root@node ~]# netstat -antup |grep 9100
tcp6       0      0 :::9100                 :::*                    LISTEN      2462/node_exporter
[root@node ~]#
3.3.6 访问测试
http://ip:9100
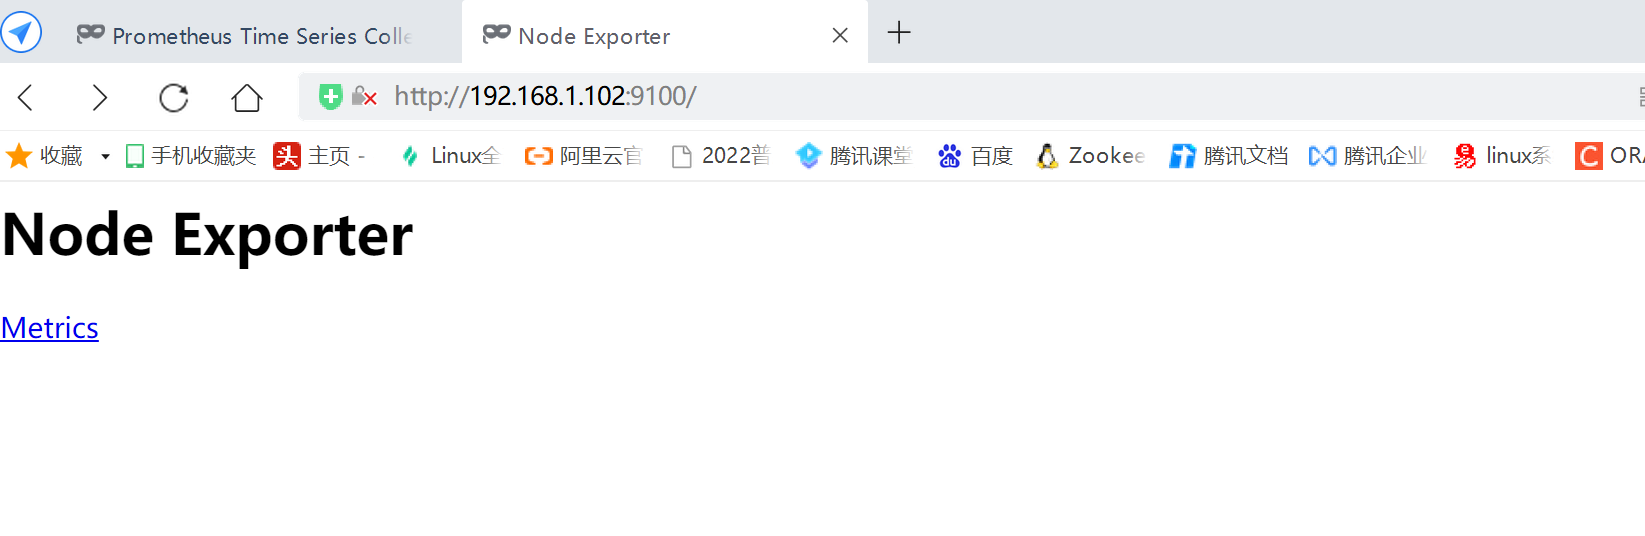
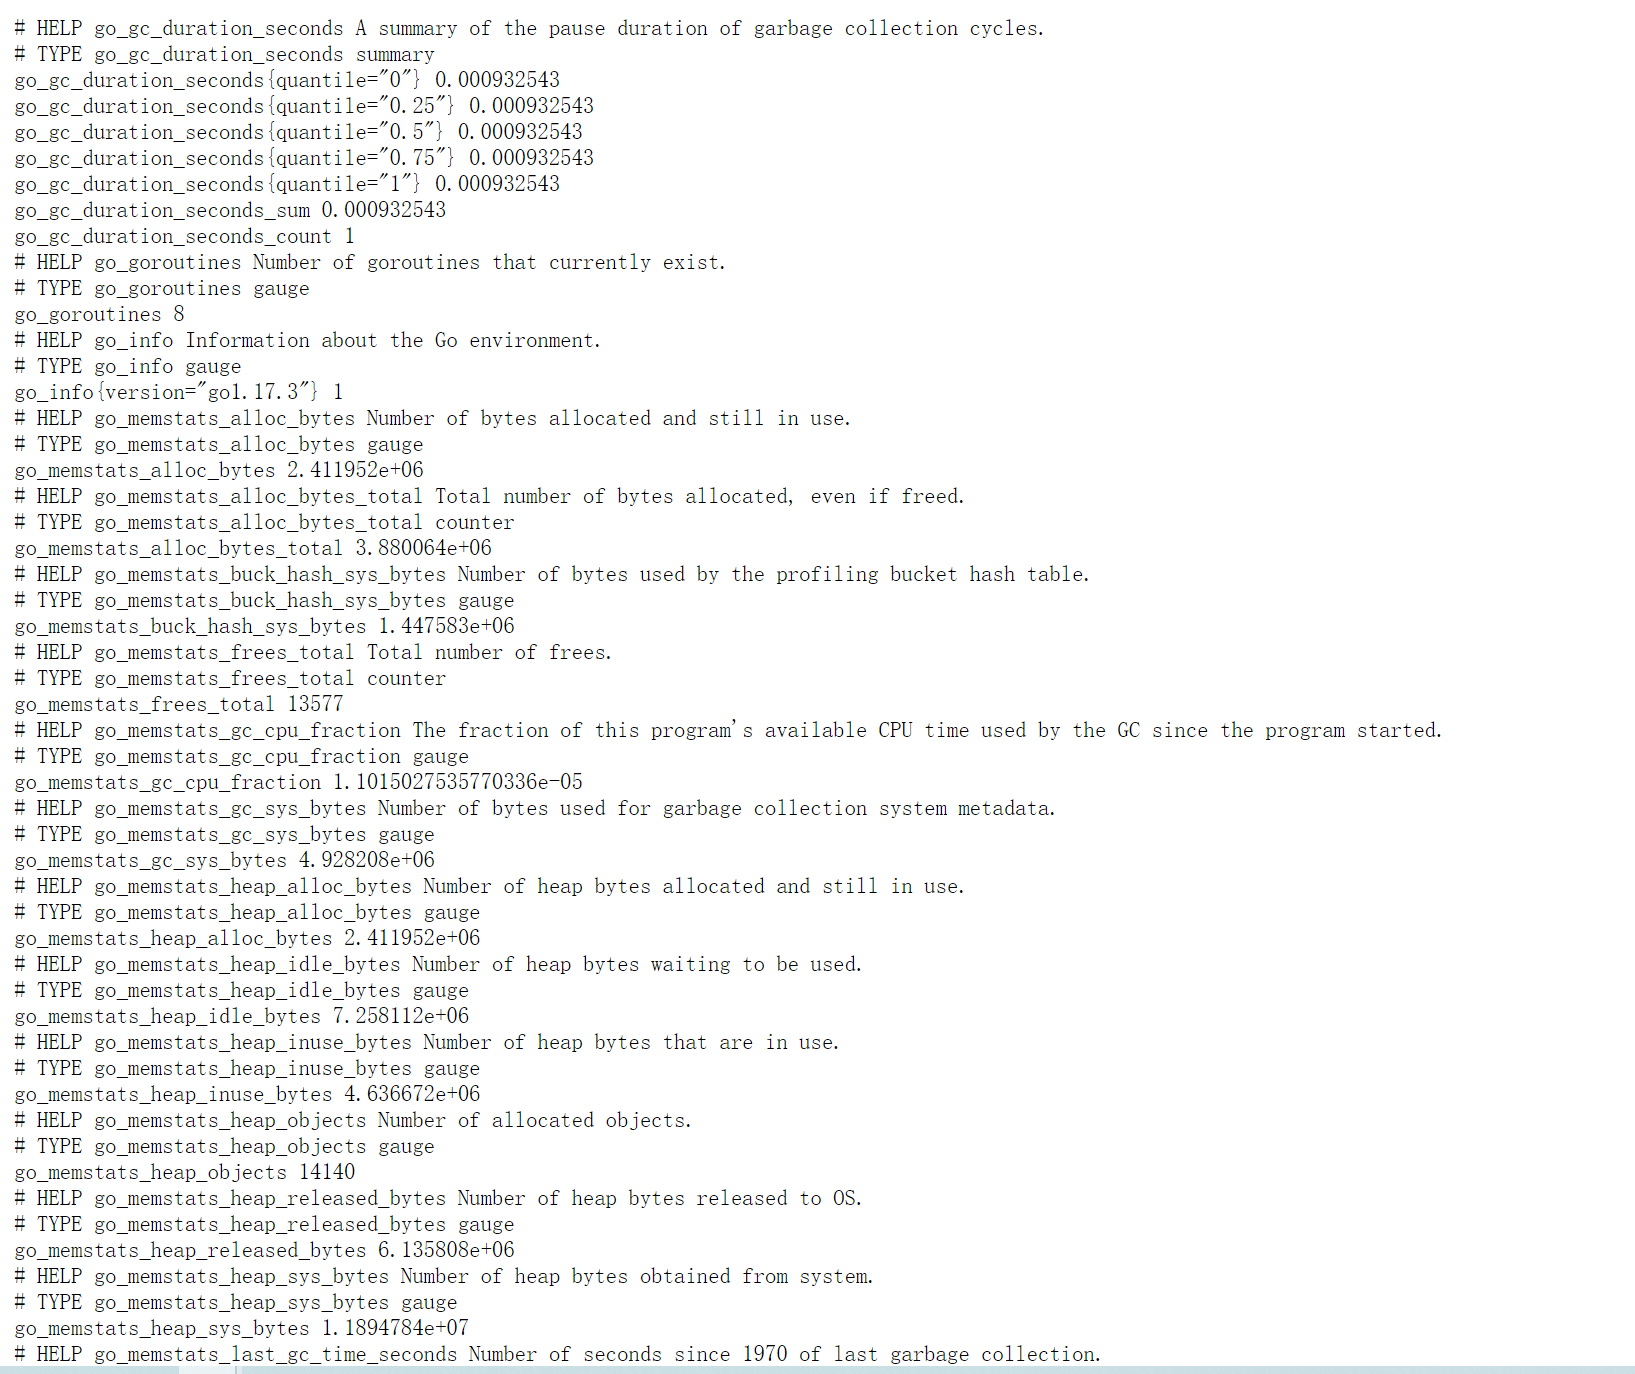
注意:这些都是Prometheus的metric的值,在prometheus中,监控的数据都是以http的方式来提供一个接口,通过prometheus来拉取数据的。
3.4 数据采集
3.4.1 静态数据采集
静态数据采集适用于当前的网络环境不大,网络结构简单的环境,可以配置proetheus的配置文件实现服务发现。
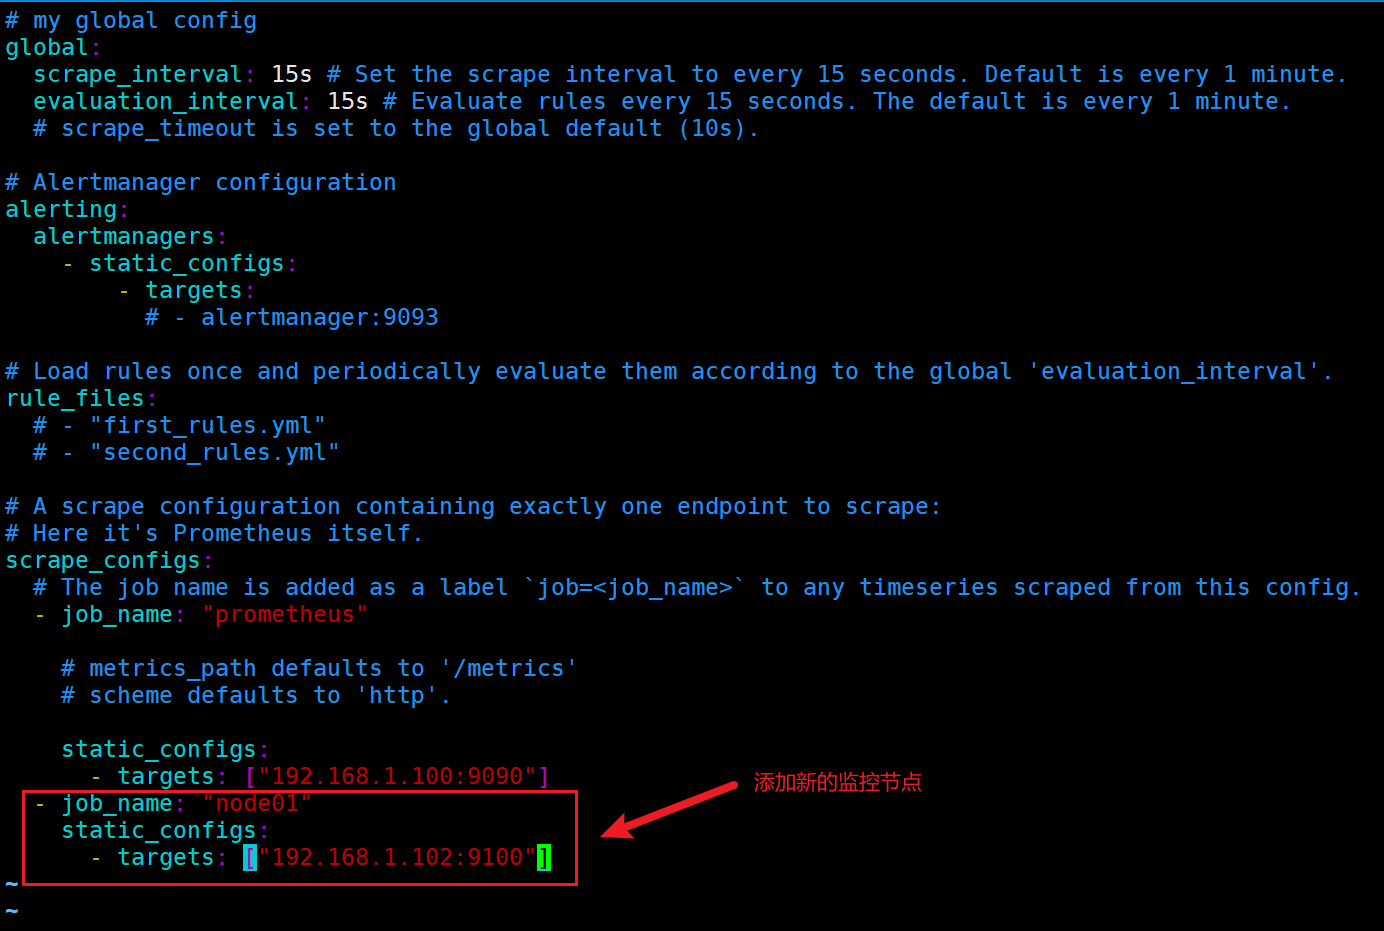
[root@prometheus-server prometheus]# vim /etc/prometheus/prometheus.yml
指标说明:
global:
  # 数据采集间隔
  scrape_interval:     15s
  # 评估告警周期
  evaluation_interval: 15s
 # 数据采集超时时间默认10s
 # scrape_timeout
手动添加其他node节点的targets示例:
- job_name: 'nowjobs'
  static_configs:
  - targets:
    - 192.168.1.101:9100
    - 192.168.1.102:9100
    - 192.168.1.103:9100
3.4.2 重启prometheus的配置
[root@prometheus-server prometheus]# jobs -l
[1]-  1527 Running                 prometheus --config.file "/etc/prometheus/prometheus.yml" &  (wd: ~)
[2]+  1539 Running                 node_exporter &  (wd: ~)
[root@prometheus-server prometheus]# kill -9 1527   ##将之前的进程kill掉
[root@prometheus-server prometheus]# prometheus --config.file "/etc/prometheus/prometheus.yml"& ##重启进程
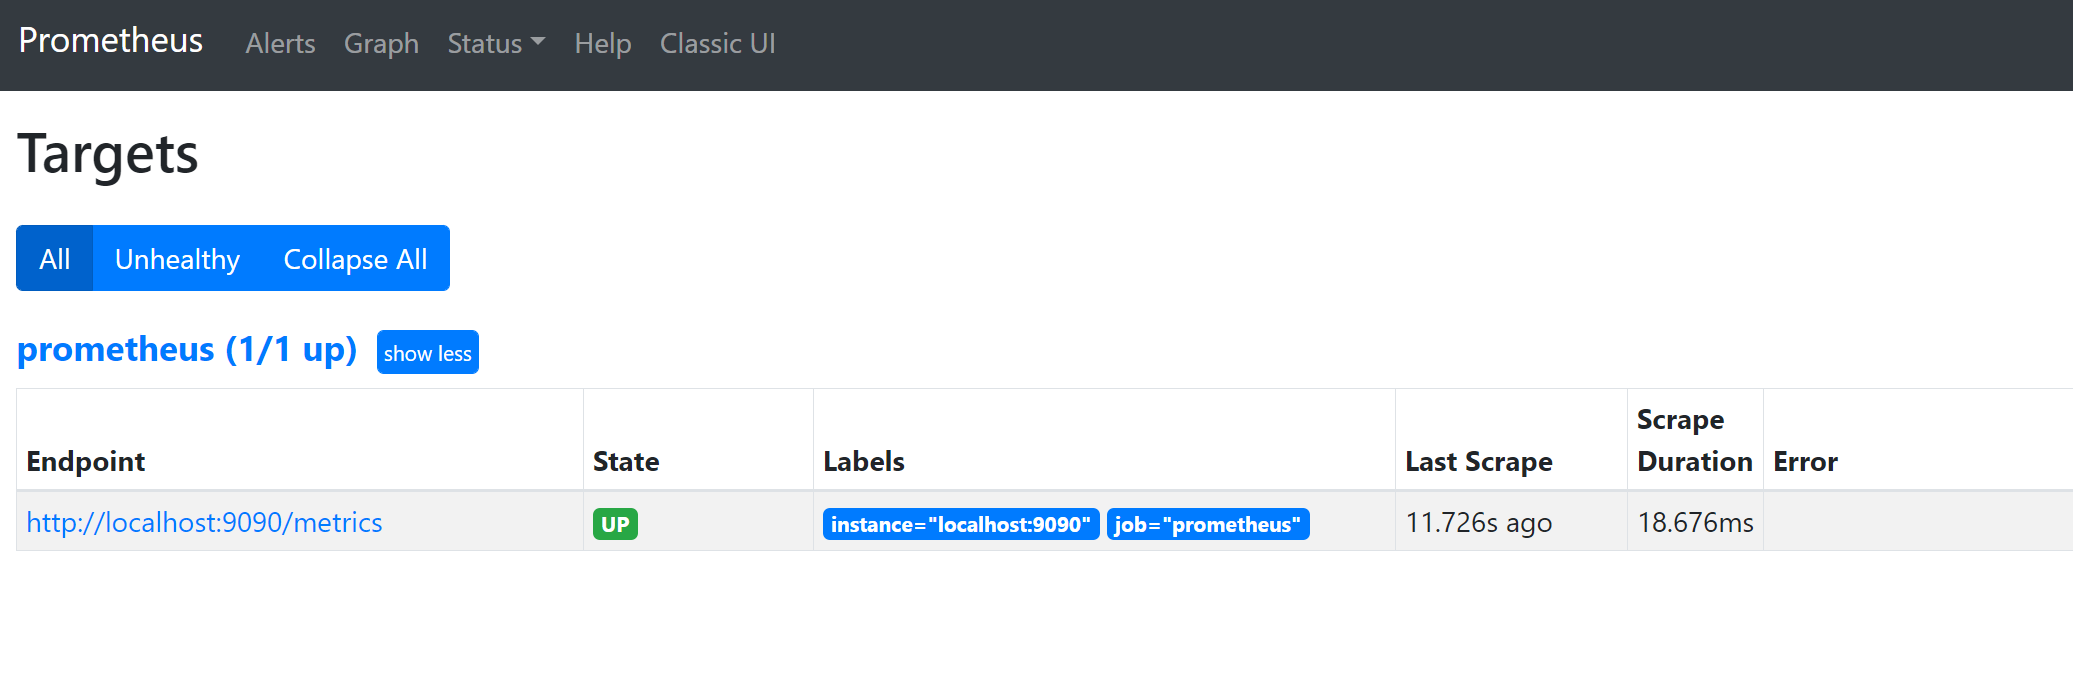
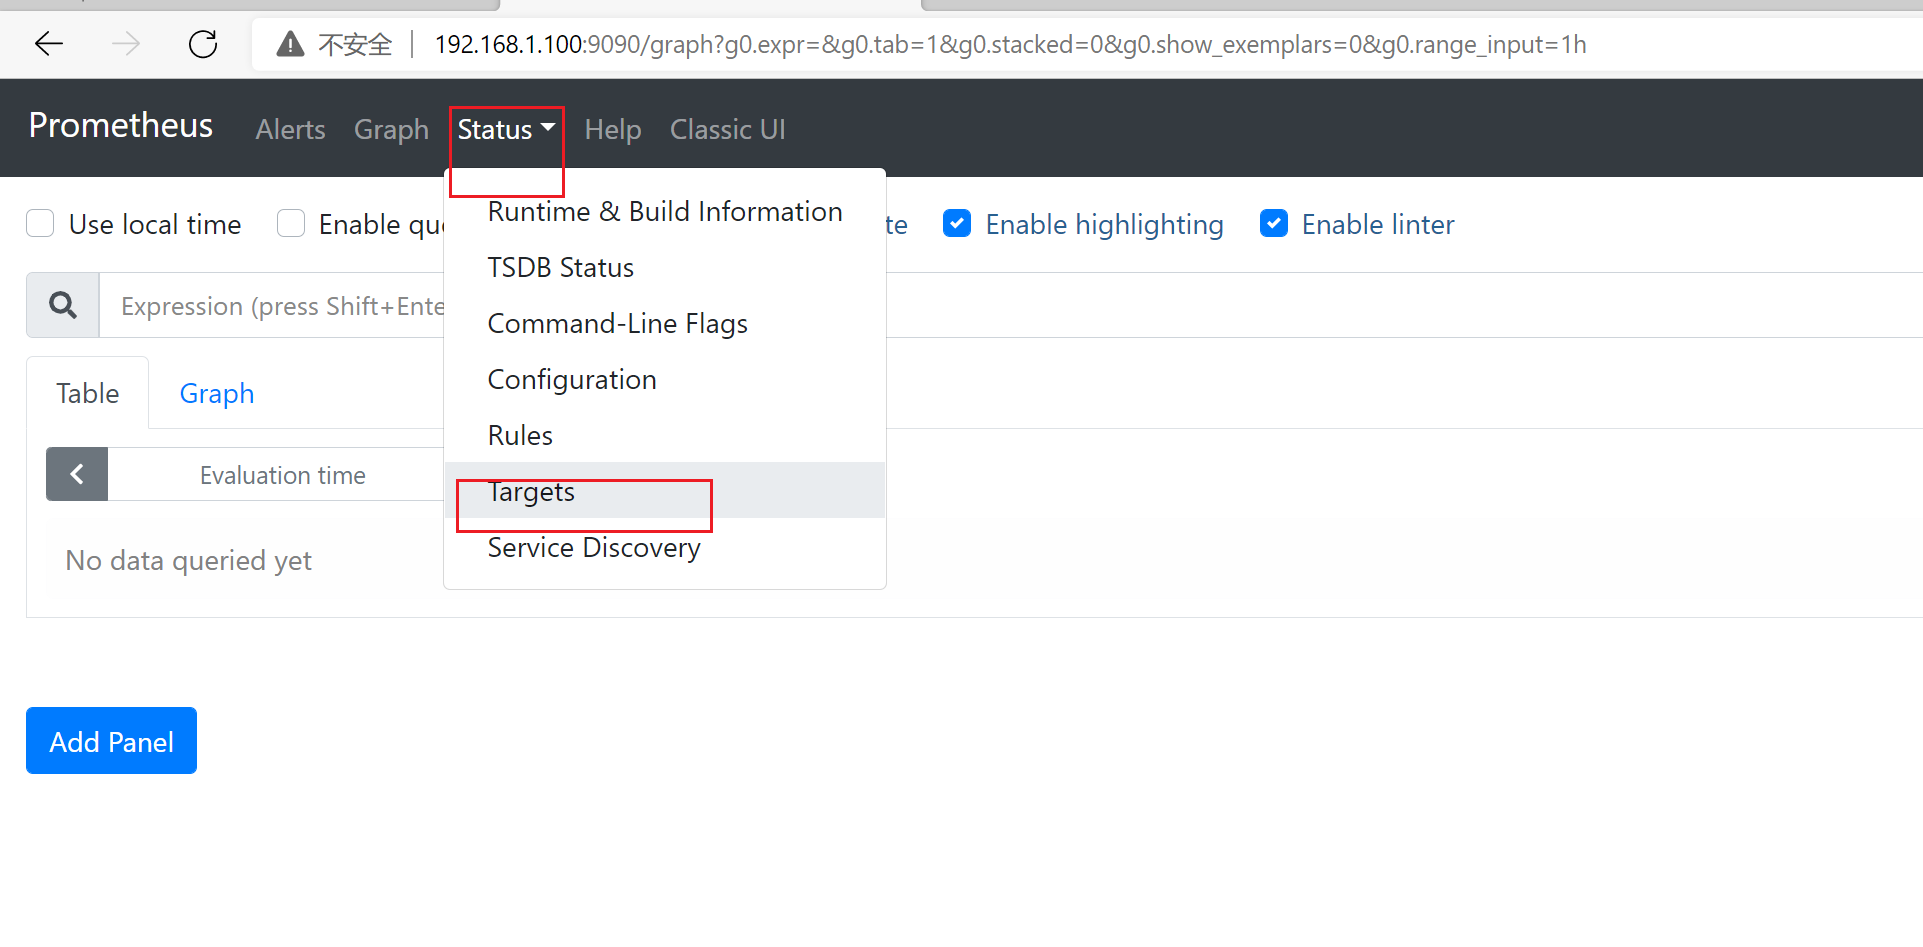
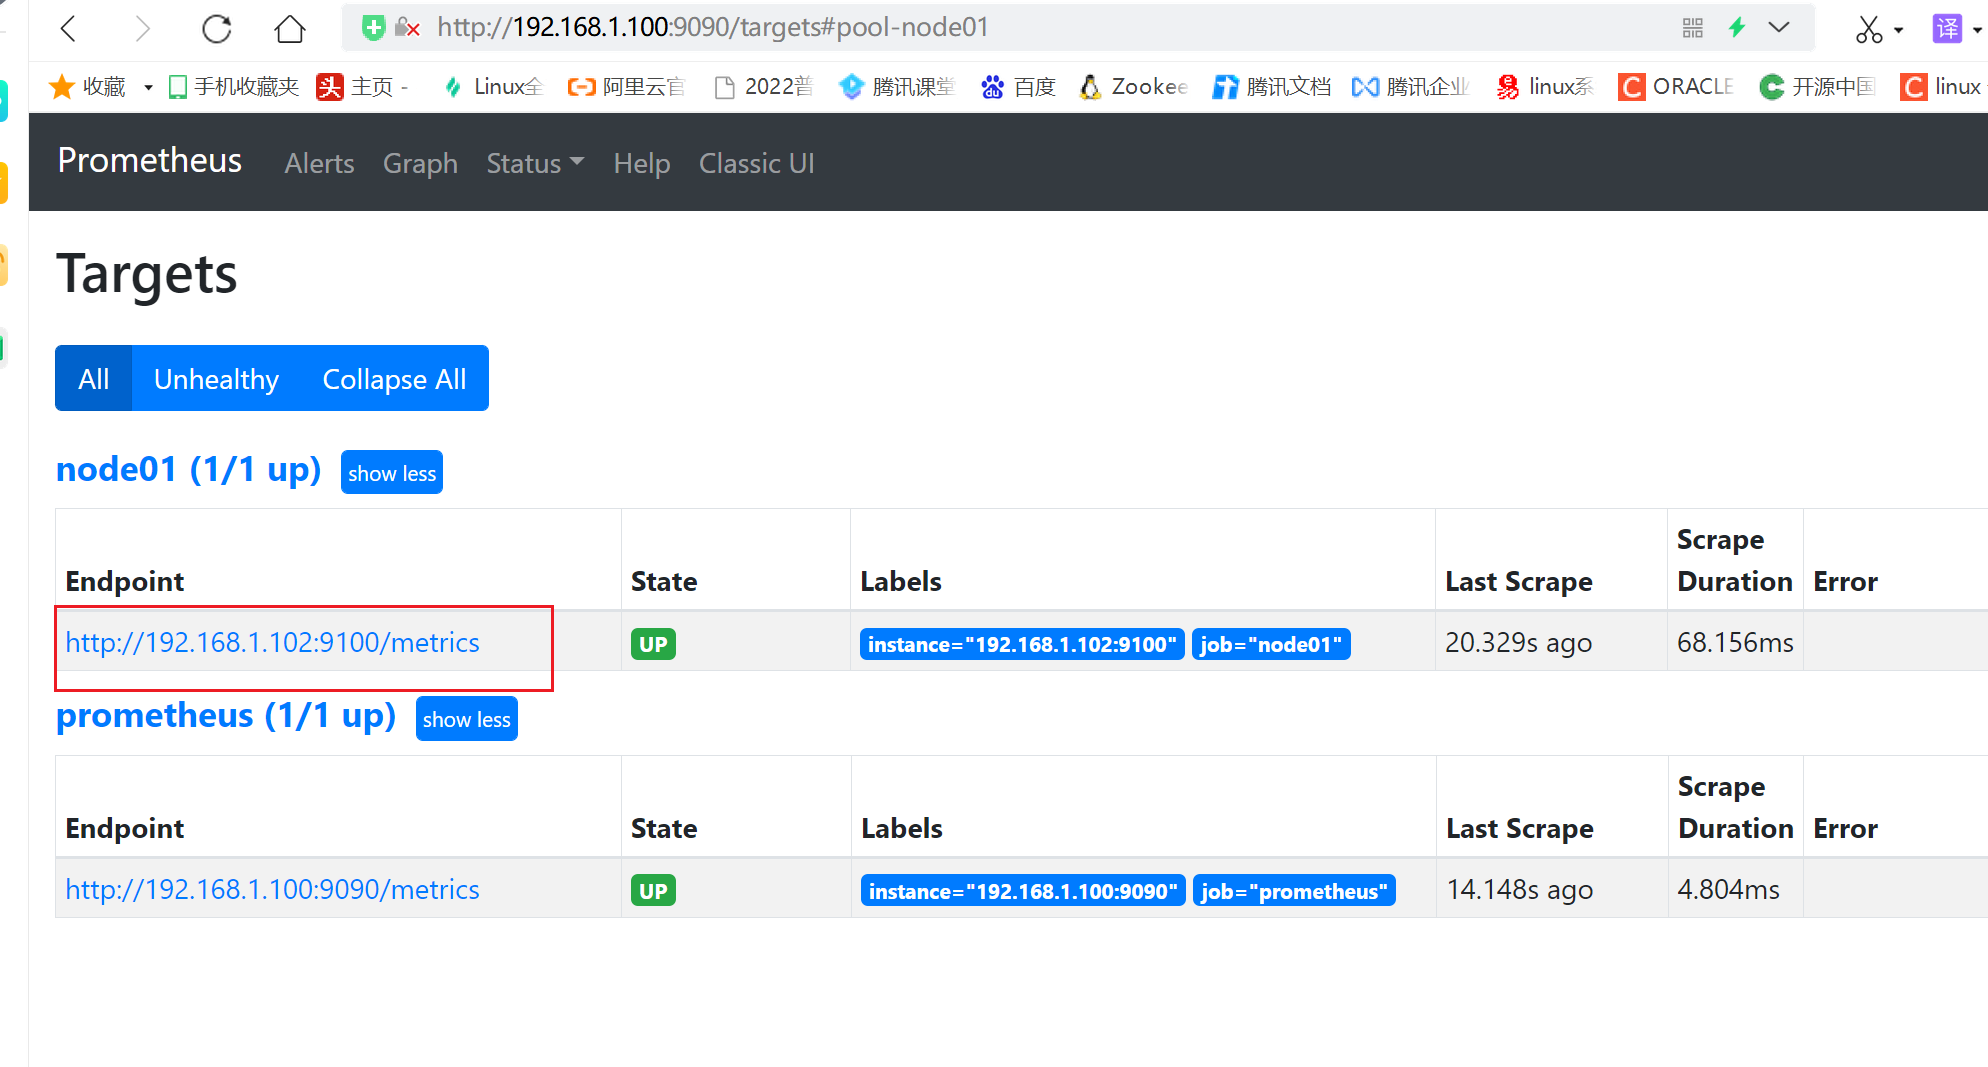
3.4.3 查看监控详情
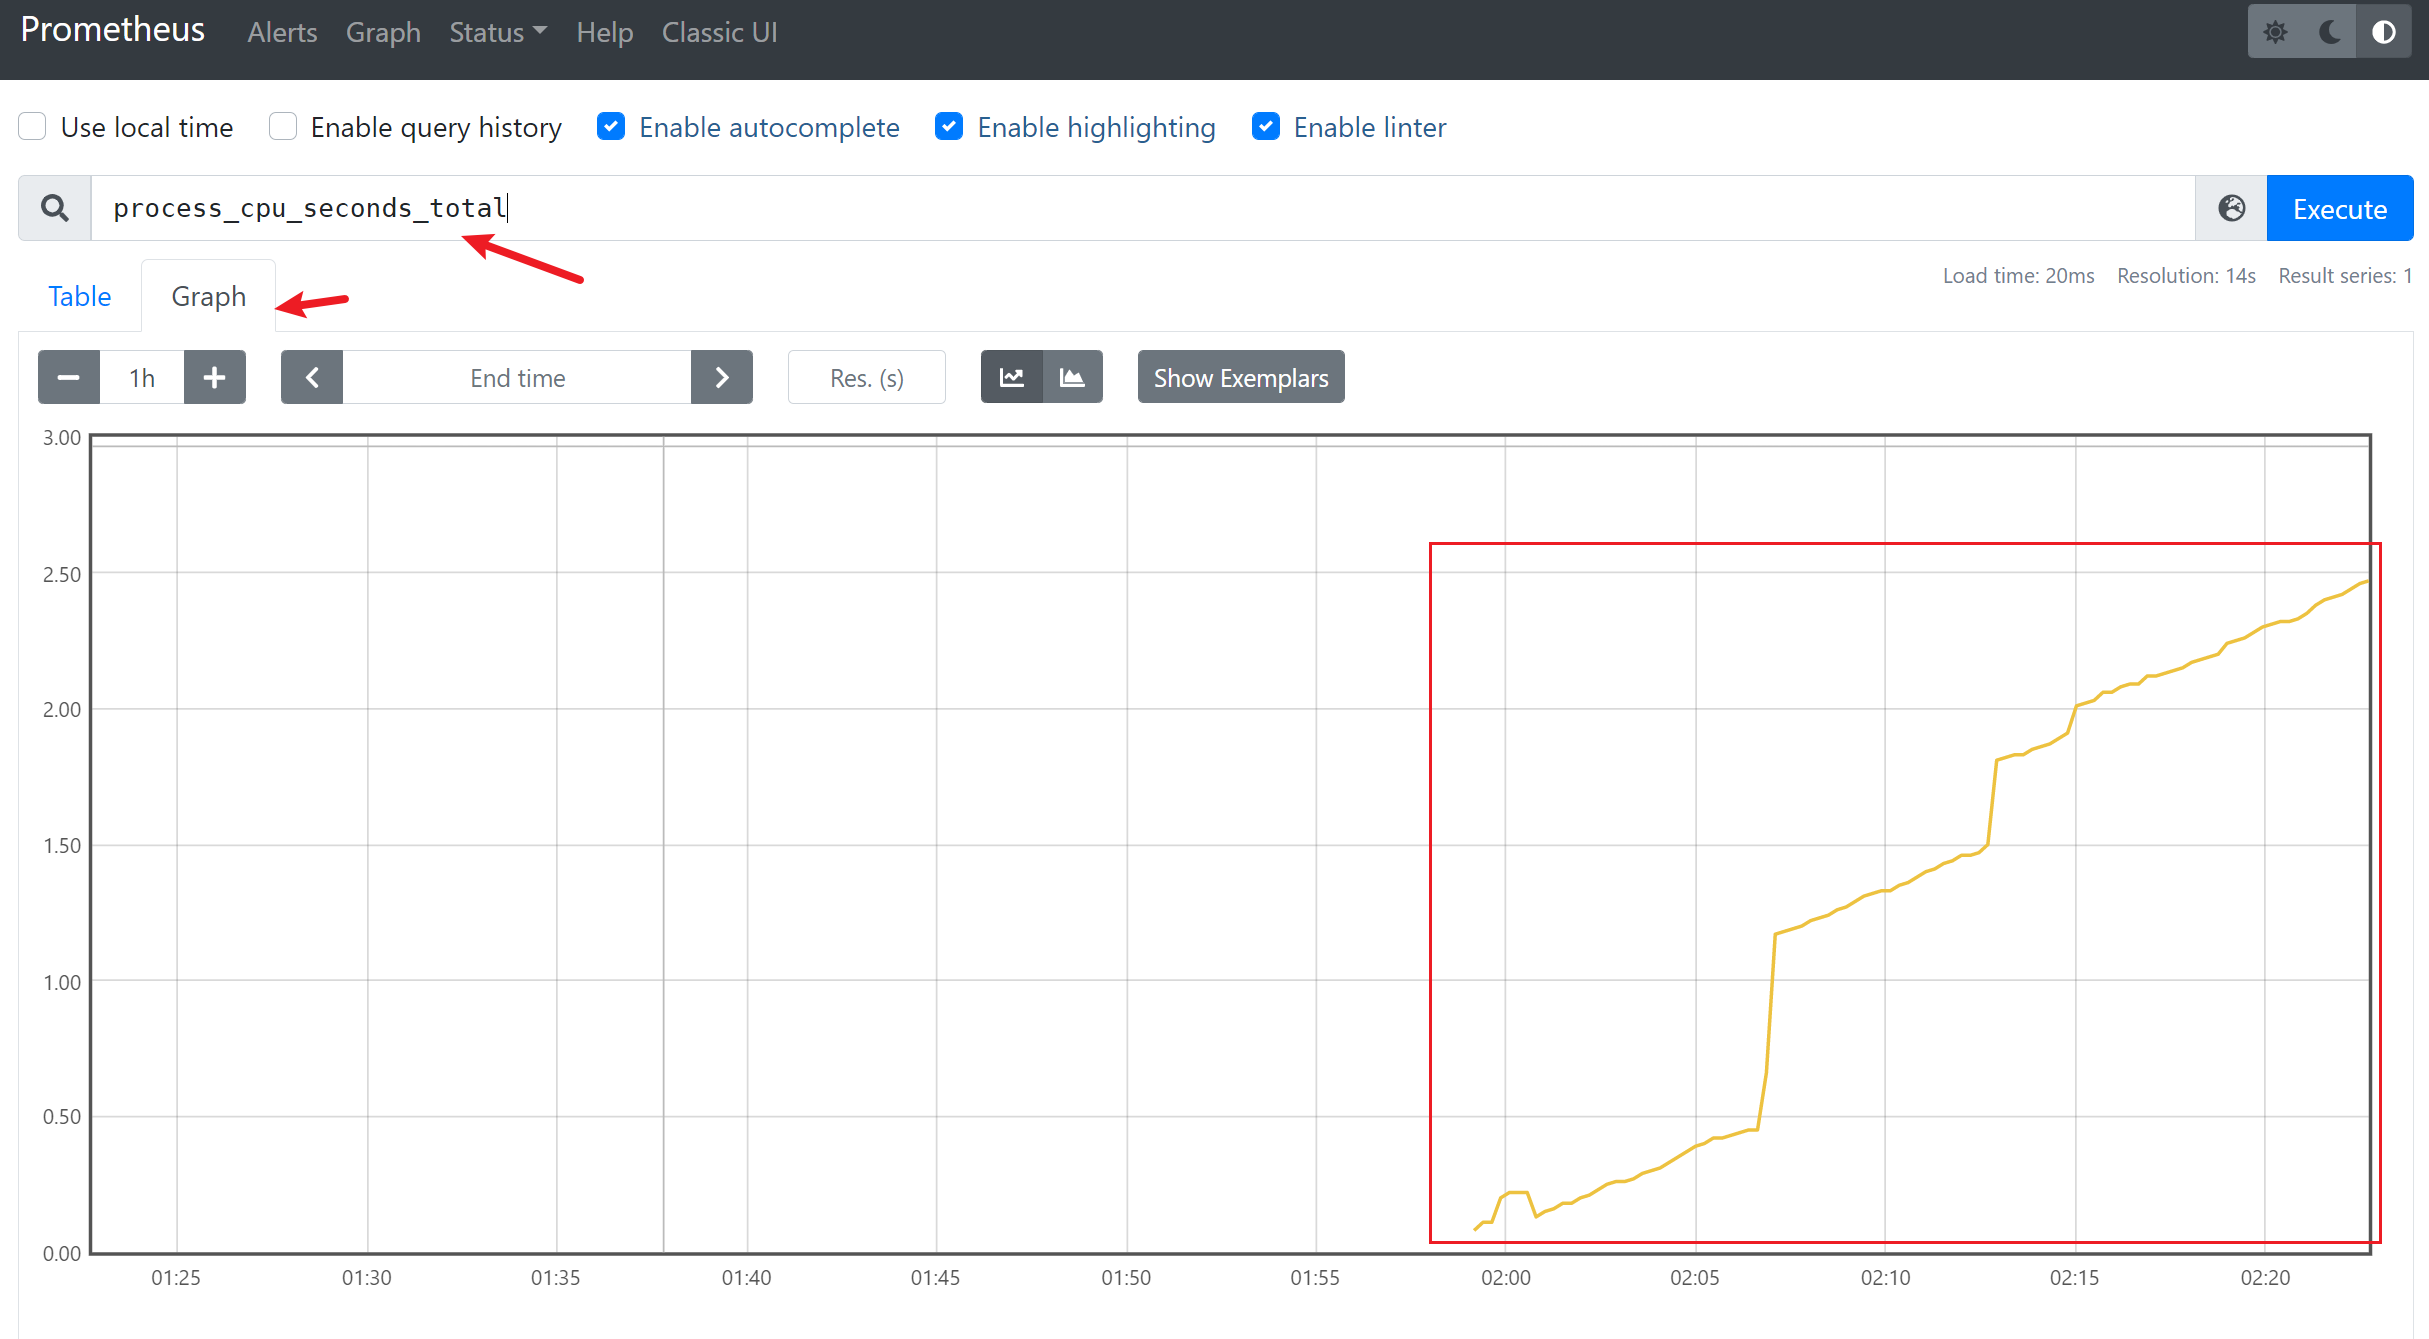
3.4.4 生成图形化
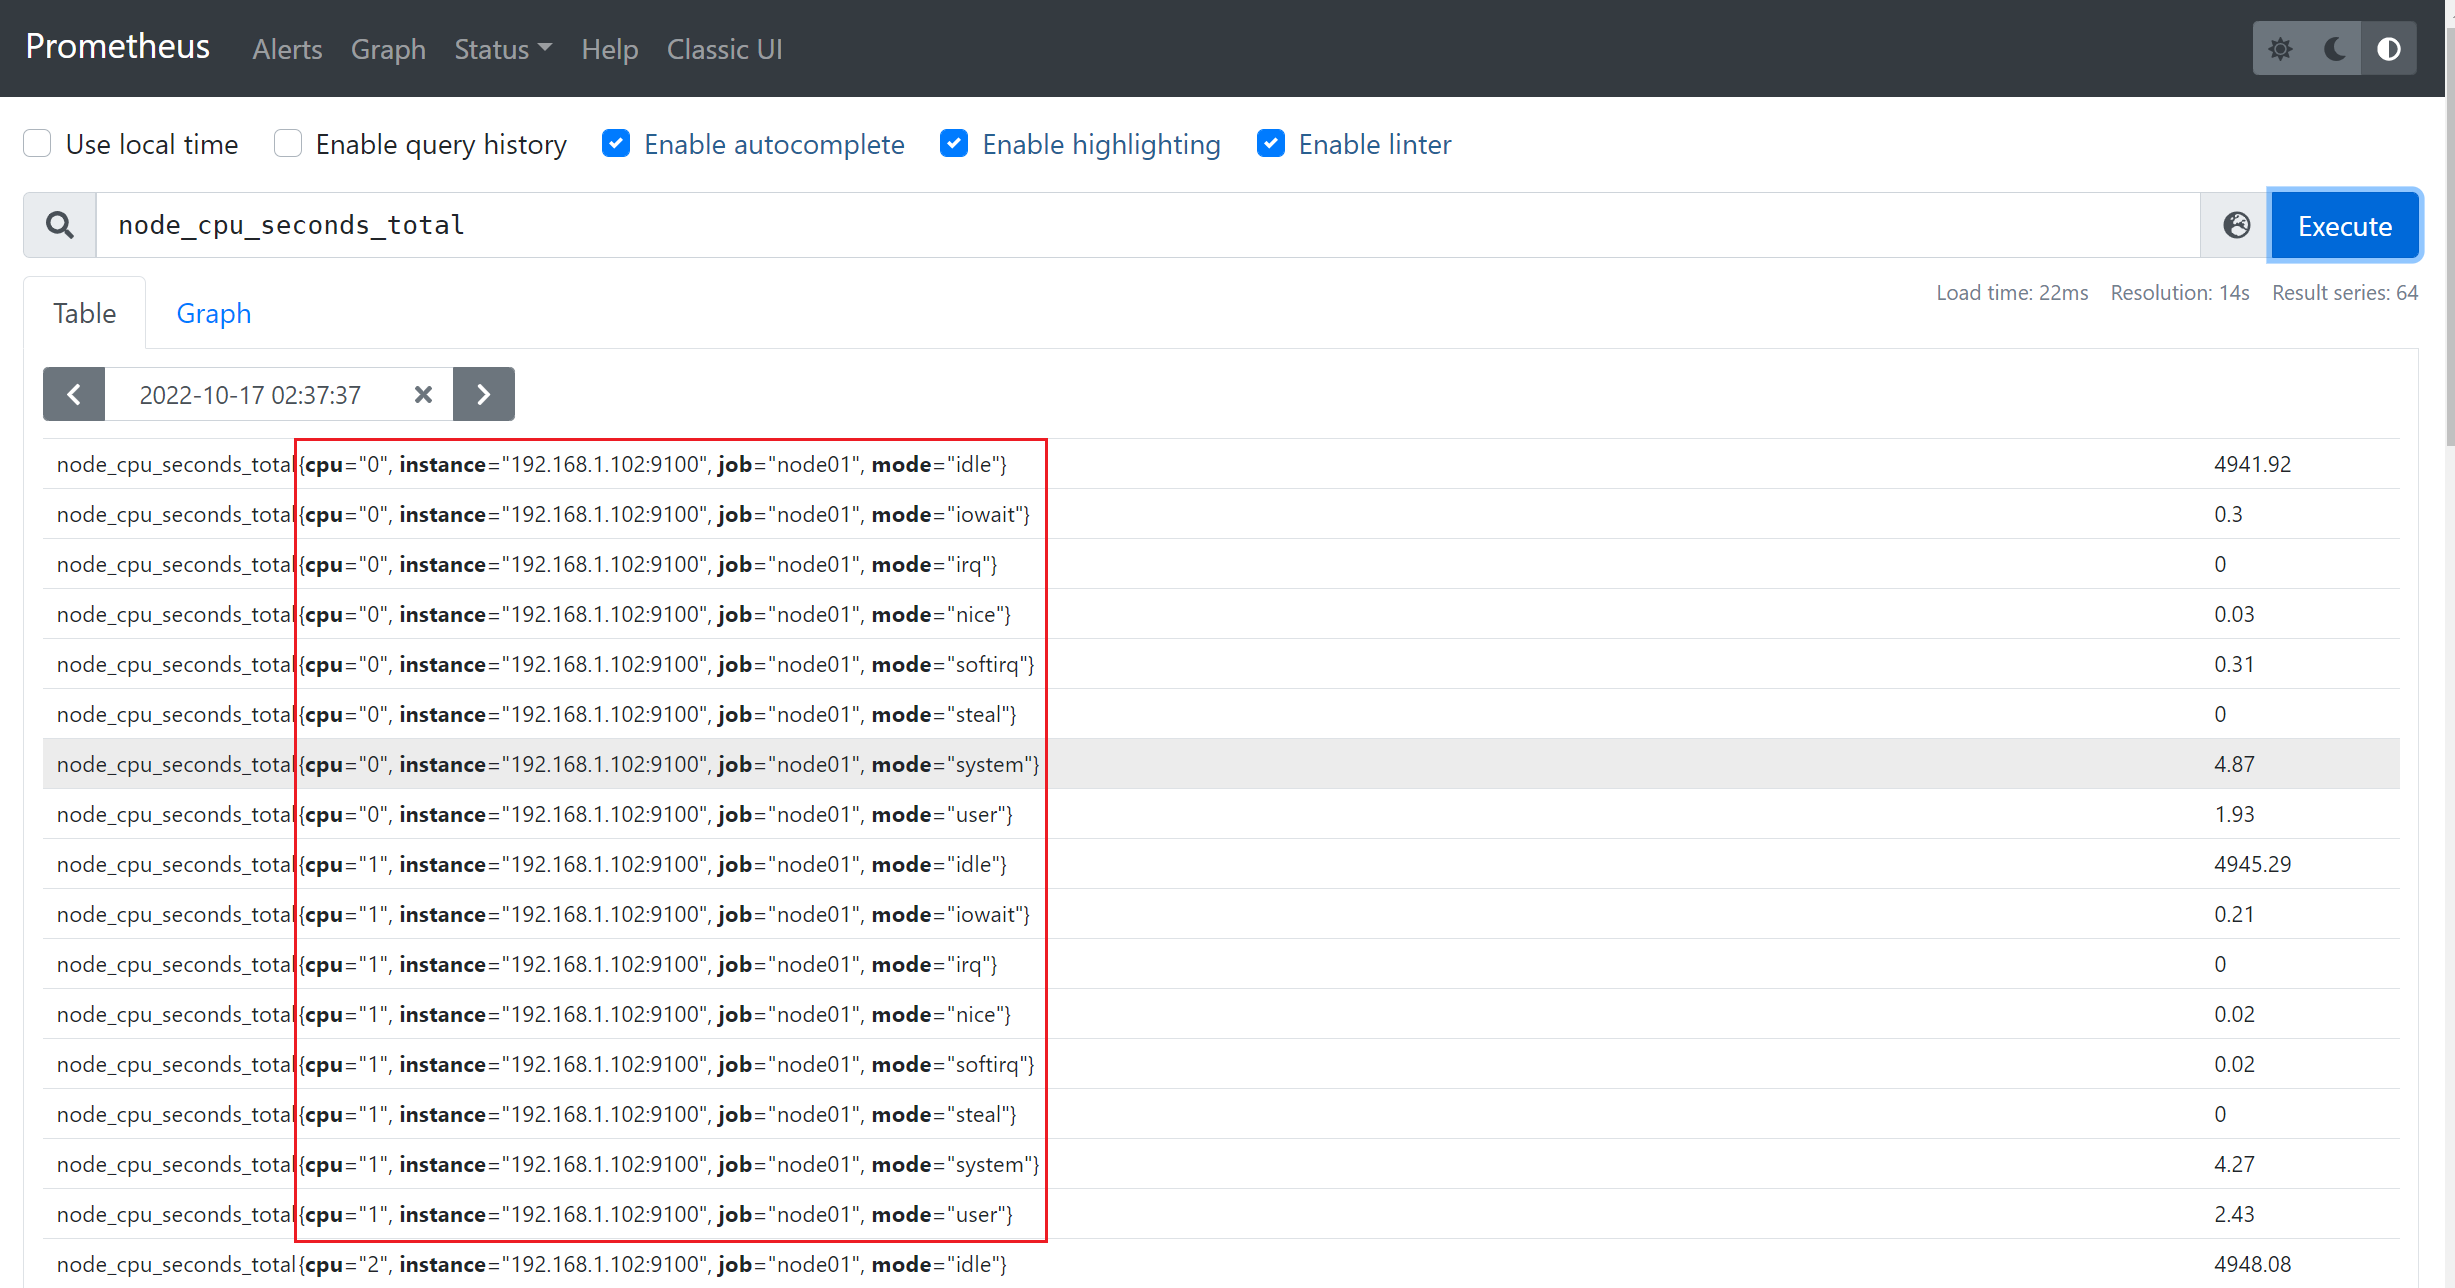
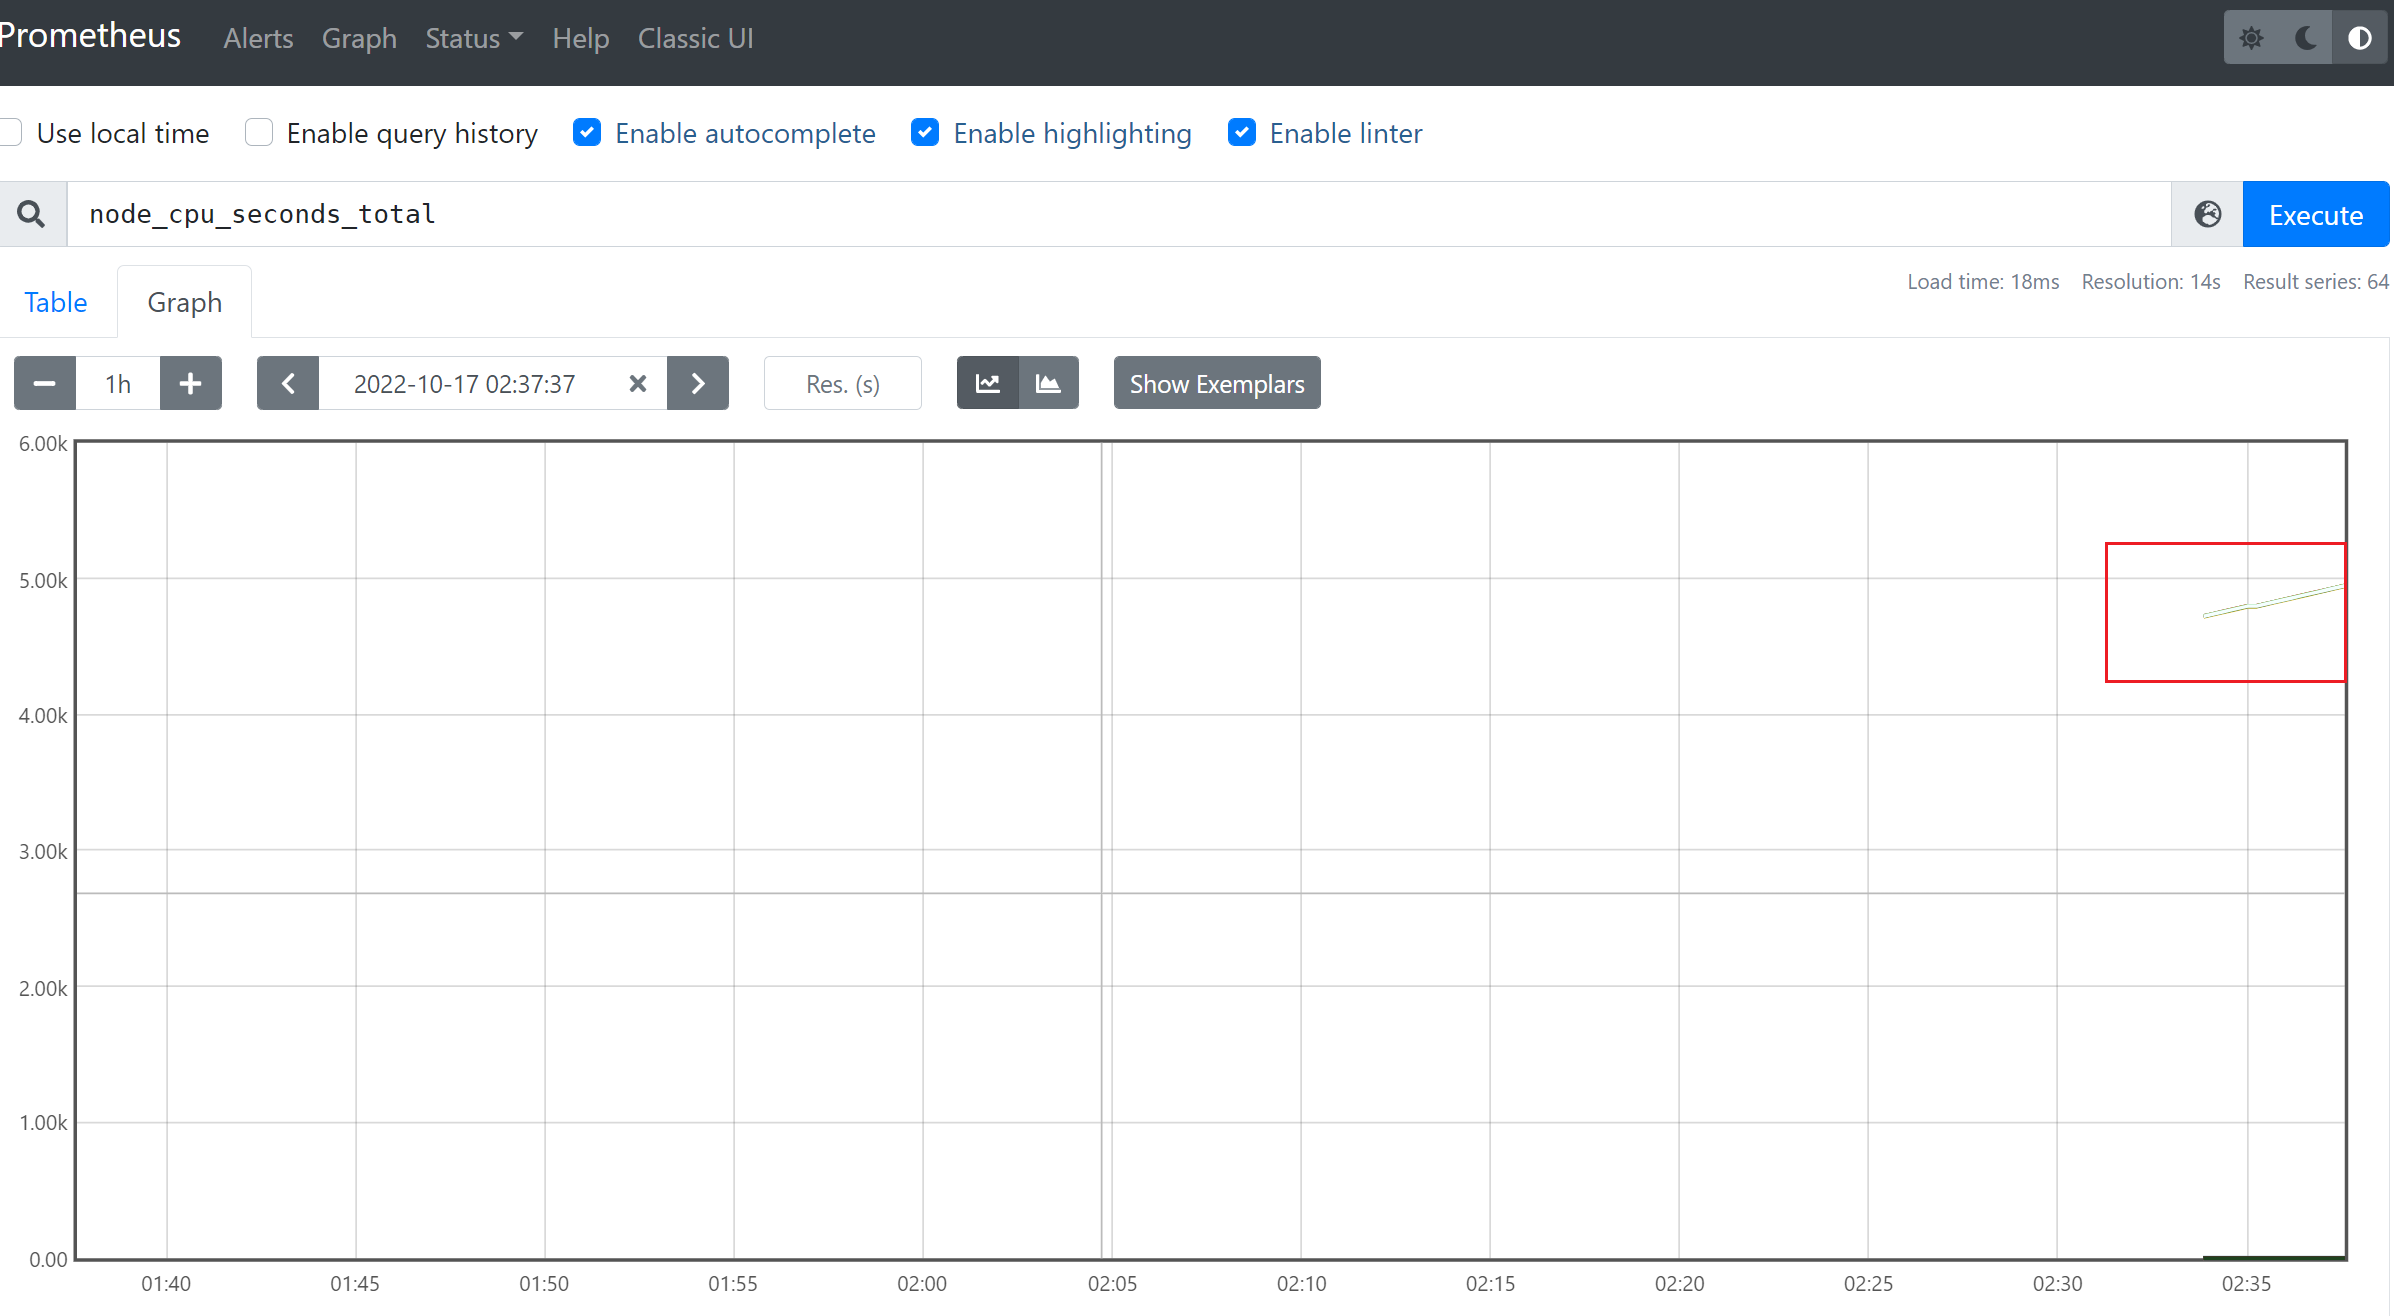
1)查看节点cpu信息
2)查看当前的磁盘IO
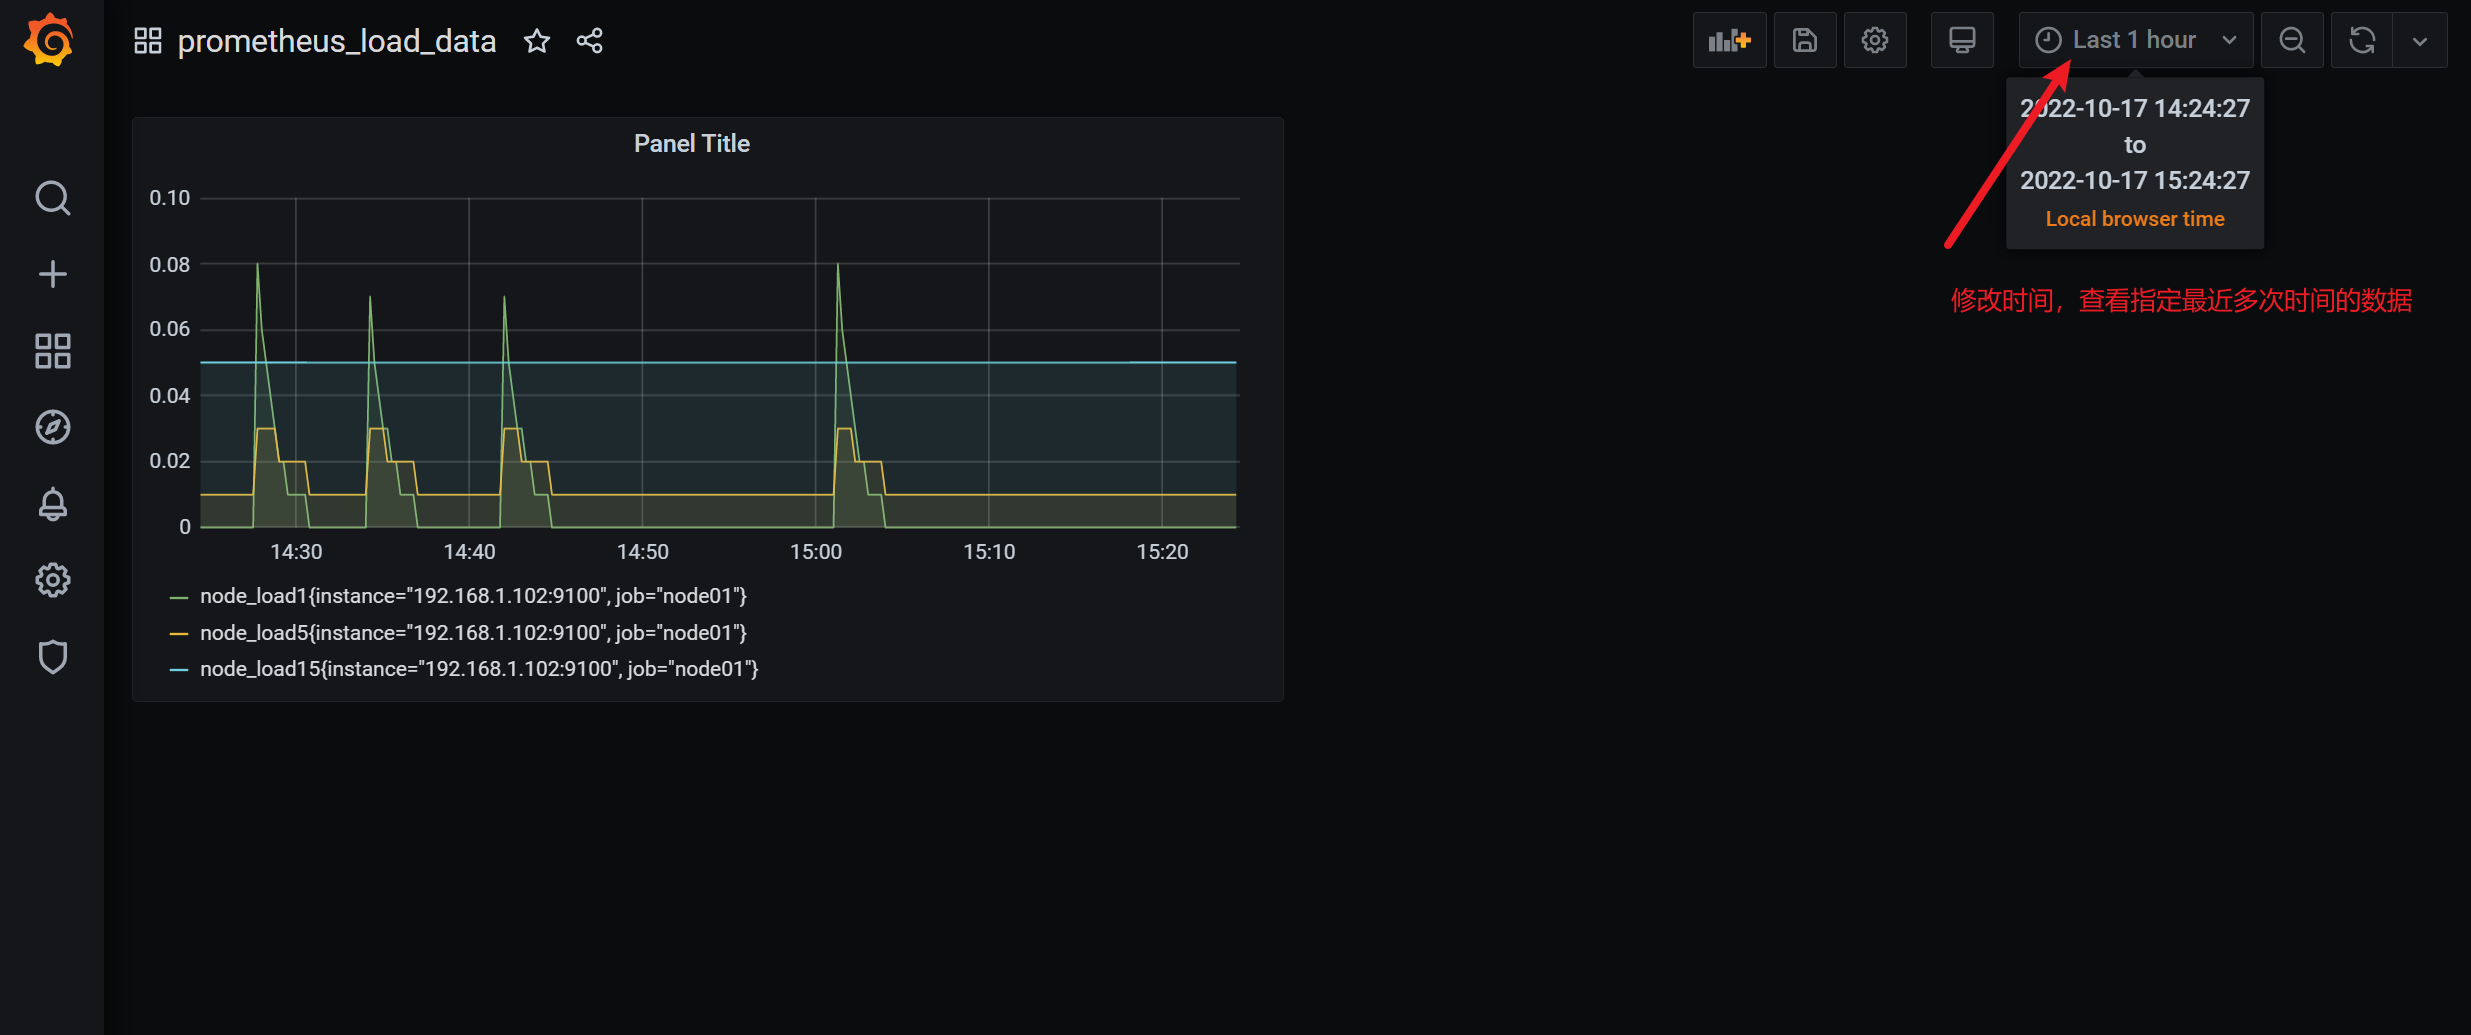
3)查看节点的CPU的平均负载
3.5 服务发现
接下来我们将学习 Prometheus 中是如何使用服务发现来查找和抓取目标的。我们知道在 Prometheus 配置文件中可以通过一个 static_configs 来配置静态的抓取任务,但是在云环境下,特别是容器环境下,抓取目标地址是经常变动的,所以用静态的方式就不能满足这些场景了。所以我们需要监控系统能够动态感知这个变化,不可能每次变动都去手动重新配置的,为了应对复杂的动态环境,Prometheus 也提供了与基础设施中的服务发现集成的功能。

Prometheus 已经支持多种内置的服务发现机制:
- 发现云服务商的 VM 虚拟机
- Kubernetes 上的自动发现
- 通用的服务查找,例如 DNS、Consul、Zookeeper 或自定义发现机制
我们都可以通过 Prometheus 配置文件中的 scrape_config 部分进行配置,Prometheus 会不断更新动态的抓取目标列表,自动停止抓取旧的实例,开始抓取新的实例,Prometheus 特别适合运行于 Kubernetes 集群下面,可以自动发现监控目标。
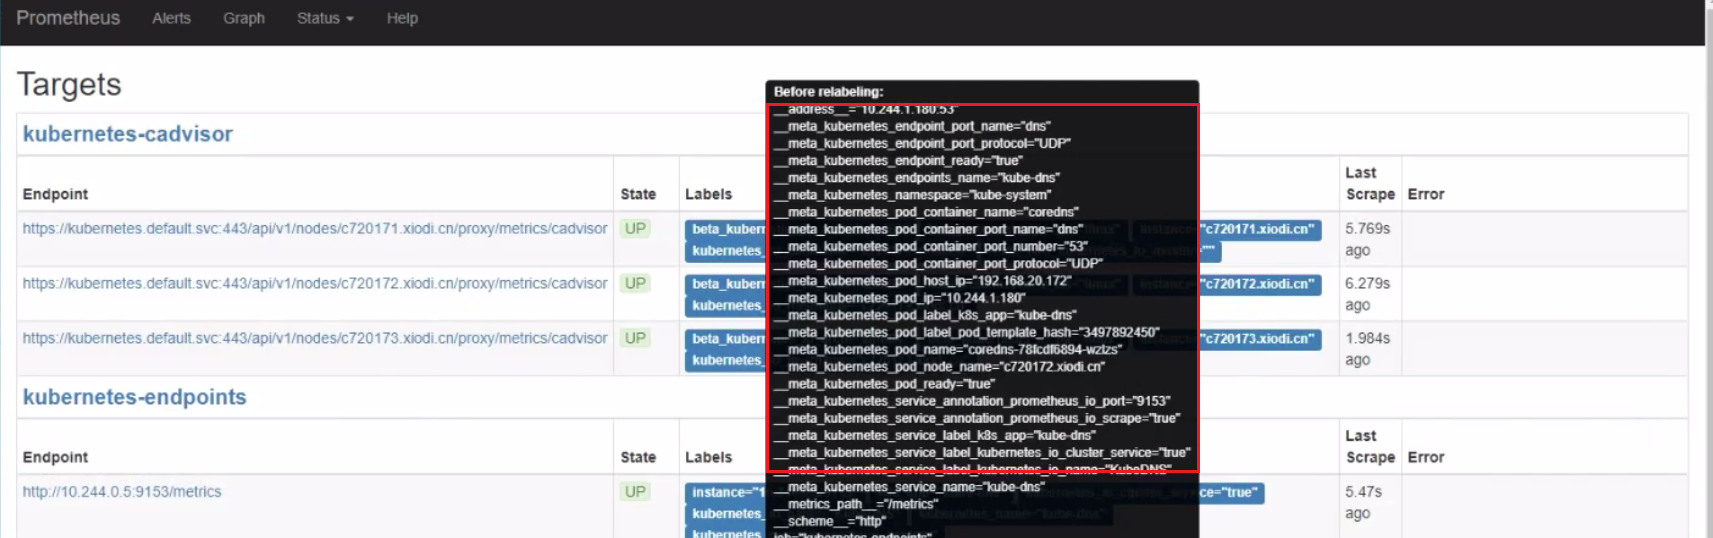
此外大部分服务发现机制还会提供目标的一些元数据,通常都是带有 __ 的前缀, 比如标签、注解、服务名等等,可以在 relabeling 阶段使用这些元数据来过滤修改目标,这些元信息标签在重新标记阶段后被删除。
3.5.1基于 Consul 的服务发现
Consul 是由 HashiCorp 开发的一个支持多数据中心的分布式服务发现和键值对存储服务的开源软件,是一个通用的服务发现和注册中心工具,被大量应用于基于微服务的软件架构当中。
接下来我们就来尝试使用 Prometheus 基于 Consul 的服务发现来监控前面的 3 个 demo 服务:
192.168.31.46:10000
192.168.31.46:10001
192.168.31.46:10002
我们将 demo 服务注册到 Consul,然后配置 Prometheus 从 Consul 中发现演示服务实例,并使用 Relabeling 操作来过滤调整目标标签。关于 Consul 本身的使用可以查看官方文档 https://learn.hashicorp.com/consul 了解更多。
3.5.1.1 安装配置 Consul
在页面 https://www.consul.io/downloads 下载符合自己系统的安装文件,比如我们这里是 Linux 系统,使用下面命令下载安装即可:
☸ ➜ wget https://releases.hashicorp.com/consul/1.10.2/consul_1.10.2_linux_amd64.zip
☸ ➜ unzip consul_1.10.2_linux_amd64.zip
# 将 consul 二进制移动到 PATH 路径下去
☸ ➜ mv consul /usr/local/bin
☸ ➜ consul version
Consul v1.10.2
Revision 3cb6eeedb
Protocol 2 spoken by default, understands 2 to 3 (agent will automatically use protocol >2 when speaking to compatible agents)
当执行 consul 命令后正常有命令提示,证明已经安装完成。接着创建一个用于注册 demo 服务的 Consul 配置文件 demo-service.json:
{
  "services": [
    {
      "id": "demo1",
      "name": "demo",
      "address": "192.168.31.46",
      "port": 10000,
      "meta": {
        "env": "production"
      },
      "checks": [
        {
          "http": "http://192.168.31.46:10000/api/foo",
          "interval": "1s"
        }
      ]
    },
    {
      "id": "demo2",
      "name": "demo",
      "address": "192.168.31.46",
      "port": 10001,
      "meta": {
        "env": "production"
      },
      "checks": [
        {
          "http": "http://192.168.31.46:10001/api/foo",
          "interval": "1s"
        }
      ]
    },
    {
      "id": "demo3",
      "name": "demo",
      "address": "192.168.31.46",
      "port": 10002,
      "meta": {
        "env": "staging"
      },
      "checks": [
        {
          "http": "http://192.168.31.46:10002/api/foo",
          "interval": "1s"
        }
      ]
    }
  ]
}
当然一般情况下我们也是在 Consul 中进行动态注册服务,但是这里我们只是简单演示 Prometheus 基于 Consul 的服务发现,这里只使用 Consul 配置文件静态注册服务即可。Consul 允许使用 JSON 中的 meta属性将 key-value 元数据与每个注册的服务实例相关联,比如这里我们配置的 env 属性和部署环境 production 或 staging 进行关联,后面我们可以通过使用 Prometheus 里面的 Relabeling 操作提取该字段并将其映射到每个抓取实例的标签中去。
为了查看更多的日志信息,我们可以在 dev 模式下运行 Consul,如下所示:
☸ ➜ consul agent -dev -config-file=demo-service.json -client 0.0.0.0
==> Starting Consul agent...
           Version: '1.10.2'
           Node ID: 'a4a9418c-7f7d-a2da-c81e-94d3d37601aa'
         Node name: 'node2'
        Datacenter: 'dc1' (Segment: '<all>')
            Server: true (Bootstrap: false)
       Client Addr: [0.0.0.0] (HTTP: 8500, HTTPS: -1, gRPC: 8502, DNS: 8600)
      Cluster Addr: 127.0.0.1 (LAN: 8301, WAN: 8302)
           Encrypt: Gossip: false, TLS-Outgoing: false, TLS-Incoming: false, Auto-Encrypt-TLS: false

==> Log data will now stream in as it occurs:
......
这里我们在启动命令后面使用 -client 参数指定了客户端绑定的 IP 地址,默认为 127.0.0.1。除了我们注册的 3 个 demo 服务之外,Consul agent 还会将自己注册为一个名为 consul 的服务,我们可以在浏览器中访问 http://<nodeip>:8500 查看注册的服务。
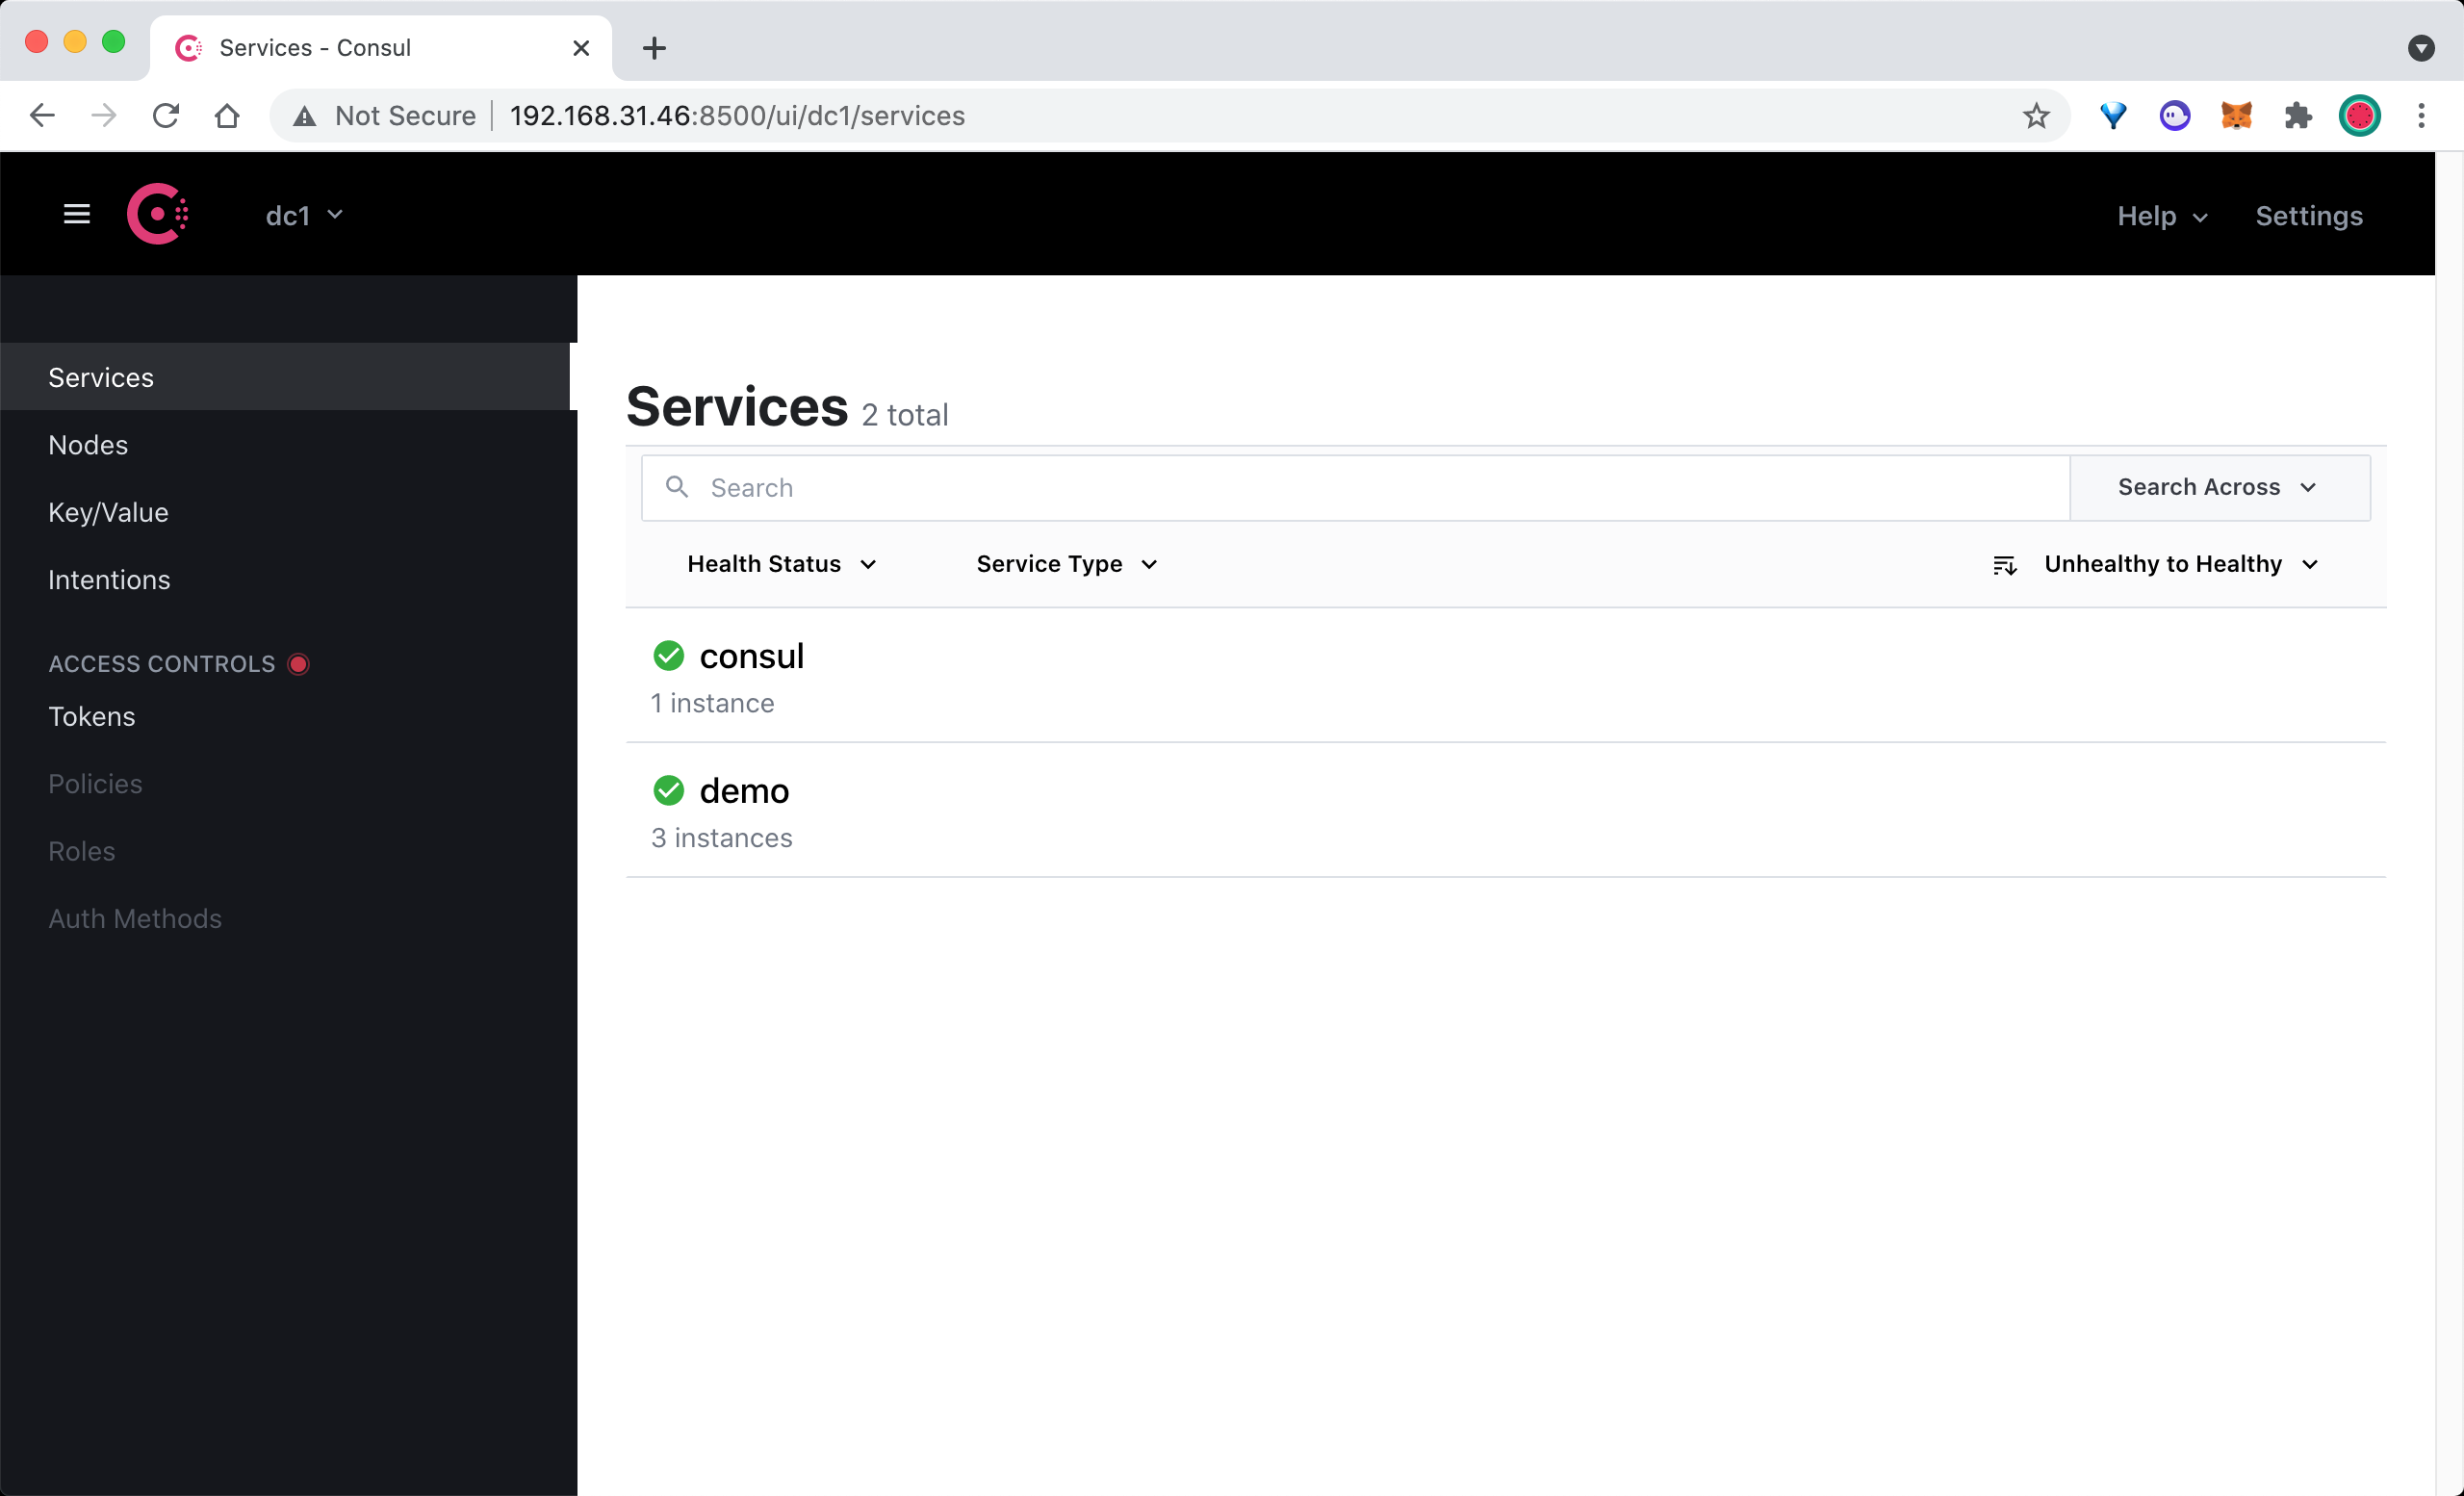
在 Consul UI 页面中可以看到有 consul 和 demo 两个 Service 服务。
3.5.1.2 配置 Consul 自动发现
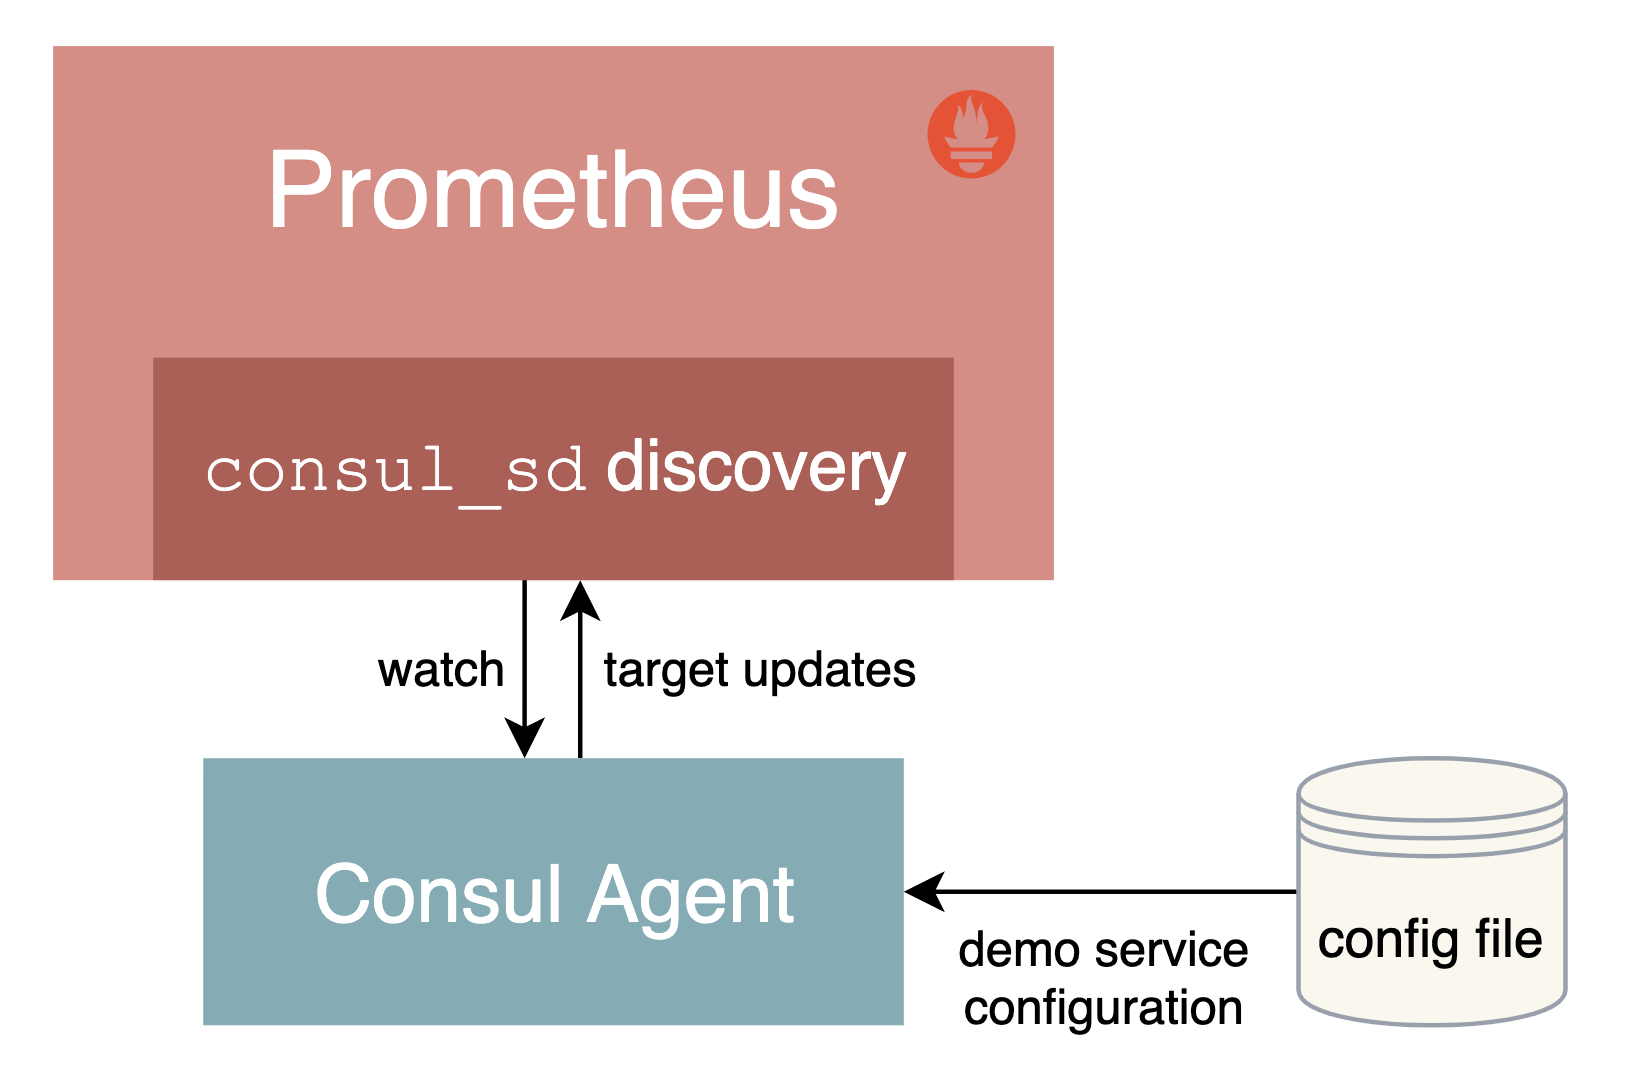
上面我们通过 Consul 注册了 3 个 demo 服务,接下来我们将配置 Prometheus 通过 Consul 来自动发现 demo 服务。
在 Prometheus 的配置文件 prometheus.yml 文件中的 scrape_configs 部分添加如下所示的抓取配置:
scrape_configs:
  - job_name: "consul-sd-demo"
    consul_sd_configs:
      - server: "localhost:8500"
    relabel_configs:
      - action: keep
        source_labels: [__meta_consul_service, __meta_consul_health]
        regex: demo;passing
      - action: labelmap
        regex: __meta_consul_service_metadata_(.*)
        replacement: consul_$1
这里我们添加了一个名为 consul-sd-demo 的抓取任务,通过 consul_sd_configs 配置用于自动发现的 Consul 服务地址,然后使用 relabel_configs 进行了重新标记配置,首先只保留服务名称为 demo,且健康状态为 passing 的,否则也会抓取 Consul Agent 本身,而它自身是不提供 metrics 接口数据的,另外还使用 labelmap 进行了标签映射,将所有 Consul 元标签映射到 Prometheus 中以 consul_ 为前缀的标签中。
配置完成后重新启动 Prometheus,然后重新查看 Prometheus 页面上的 targets 页面,验证上面的配置是否存在:
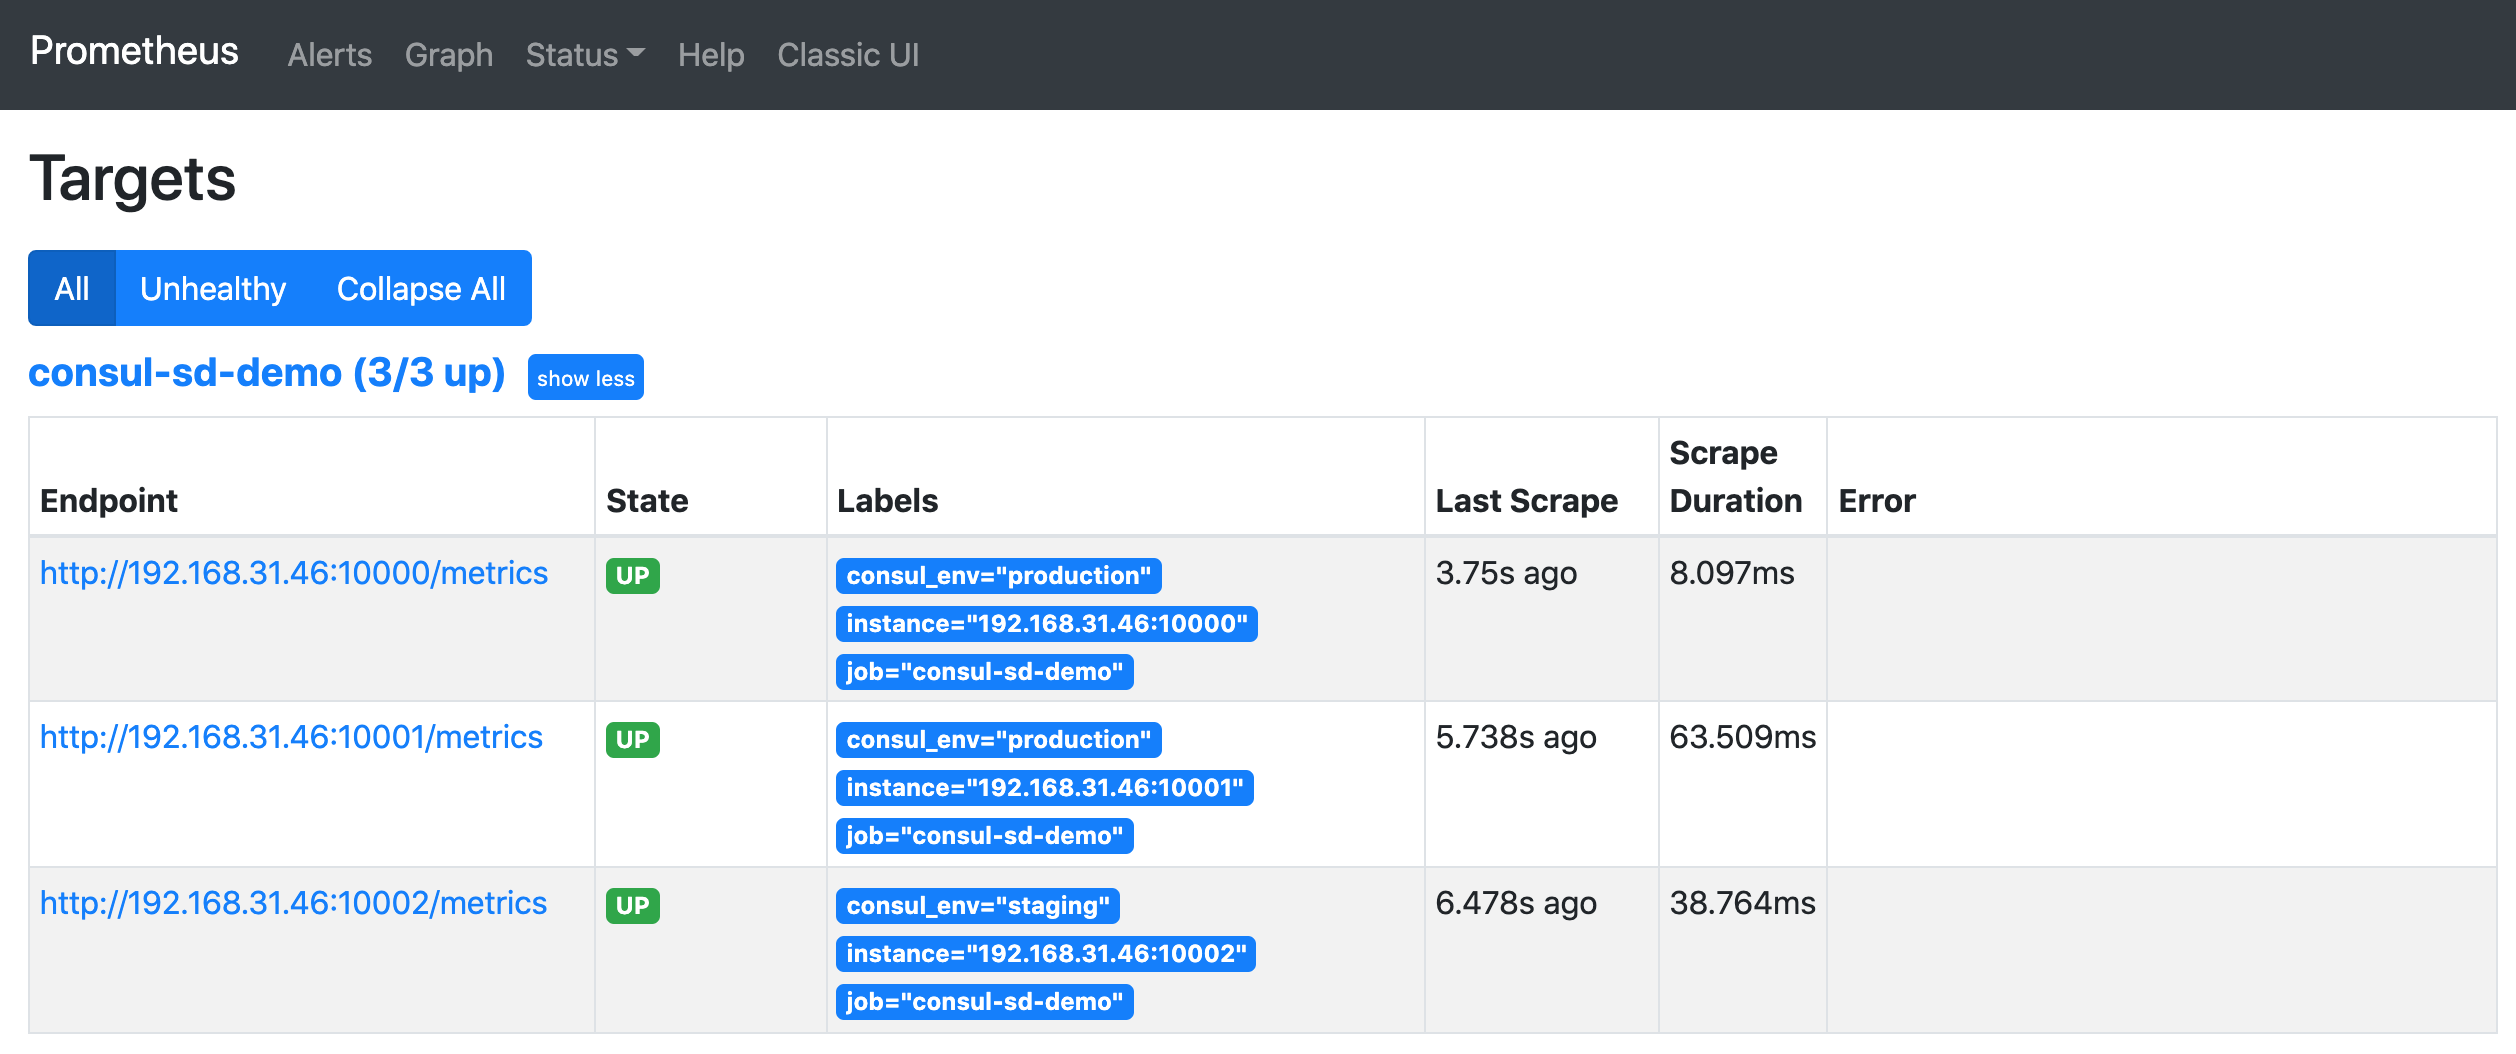
正常情况下是可以看到会有一个 consul-sd-demo 的任务,下面有 3 个自动发现的抓取目标。
我们将鼠标悬停在 Labels 标签区域就可以看到目标任务在重新标记 Relabeling 之前的原始标签。比如我们将查看第一个 demo 实例在 Relabel 之前包含如下所示的这些原始标签:
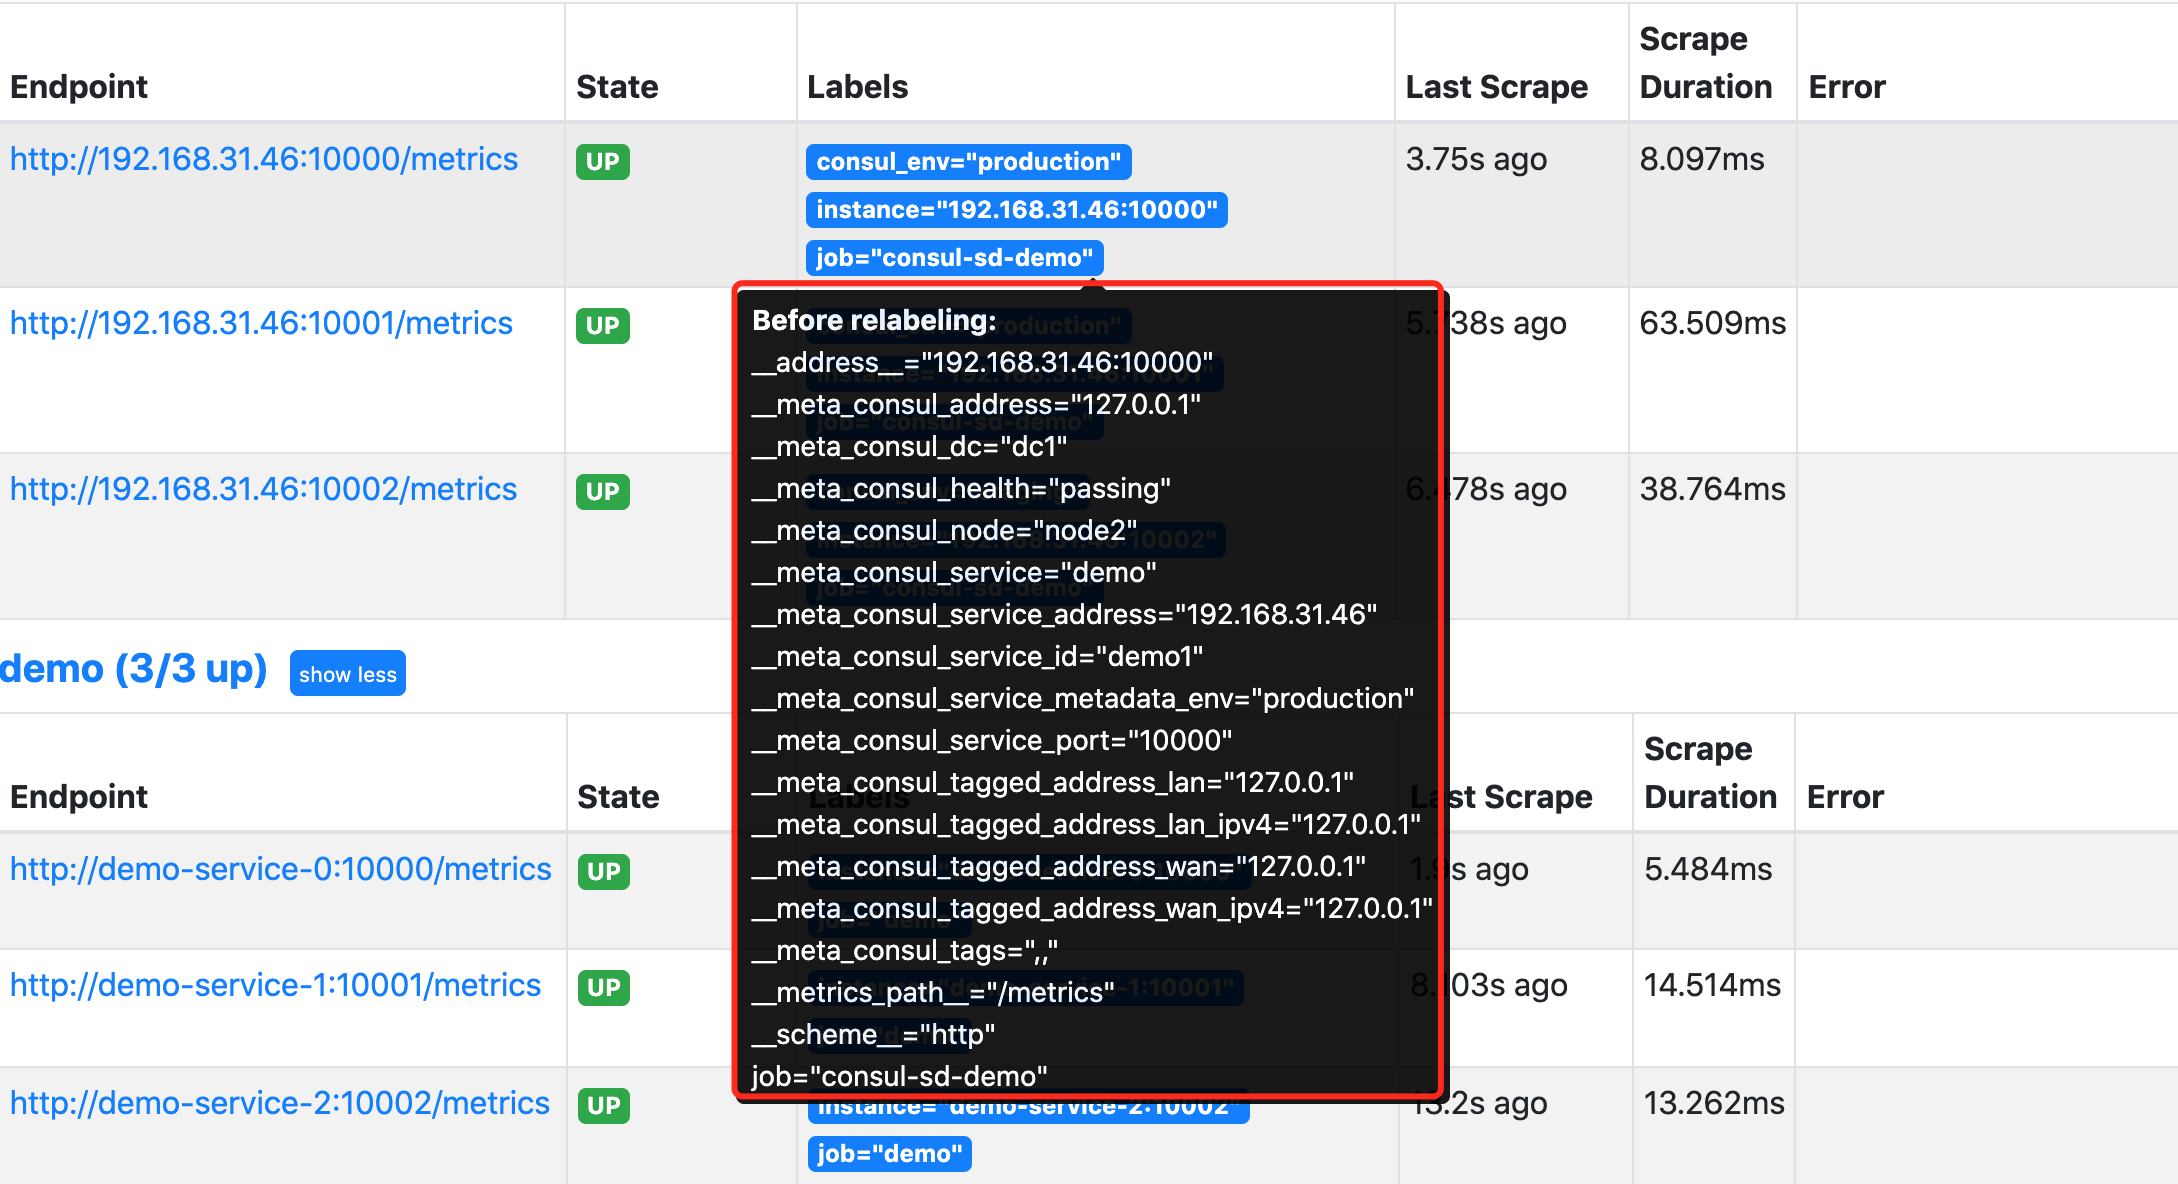
通过查看网络请求接口 http://<promtheus addr>/api/v1/targets?state=active 也可以获取对应的原始标签数据:
{
  "discoveredLabels": {
    "__address__": "192.168.31.46:10000",
    "__meta_consul_address": "127.0.0.1",
    "__meta_consul_dc": "dc1",
    "__meta_consul_health": "passing",
    "__meta_consul_node": "node2",
    "__meta_consul_service": "demo",
    "__meta_consul_service_address": "192.168.31.46",
    "__meta_consul_service_id": "demo1",
    "__meta_consul_service_metadata_env": "production",
    "__meta_consul_service_port": "10000",
    "__meta_consul_tagged_address_lan": "127.0.0.1",
    "__meta_consul_tagged_address_lan_ipv4": "127.0.0.1",
    "__meta_consul_tagged_address_wan": "127.0.0.1",
    "__meta_consul_tagged_address_wan_ipv4": "127.0.0.1",
    "__meta_consul_tags": ",,",
    "__metrics_path__": "/metrics",
    "__scheme__": "http",
    "job": "consul-sd-demo"
  },
  "labels": {
    "consul_env": "production",
    "instance": "192.168.31.46:10000",
    "job": "consul-sd-demo"
  },
  "scrapePool": "consul-sd-demo",
  "scrapeUrl": "http://192.168.31.46:10000/metrics",
  "globalUrl": "http://192.168.31.46:10000/metrics",
  "lastError": "",
  "lastScrape": "2021-09-28T11:56:01.919216851+08:00",
  "lastScrapeDuration": 0.013357276,
  "health": "up"
}
我们在 relabel_configs 中首先配置了一个 keep 操作,只保留原始标签 __meta_consul_service 值为 demo,且 __meta_consul_health 为 passing 状态的抓取任务。然后使用 labelmap 进行标签映射,这里我们将匹配 __meta_consul_service_metadata_(.*) 所有标签,这里只有 __meta_consul_service_metadata_env 这个原始标签符合正则表达式,其中的 env 就是匹配的捕获组,在 replacement 中用 $1 代替,替换成标签 consul_$1,也就是 consul_env 这个标签了,所以 Relabeling 过后就只剩下下面的几个目标标签了:
instance: "192.168.31.46:10000"
job: "consul-sd-demo"
consul_env: "production"
其中的 instance 标签是在重新标记之后,自动从 __address__ 转变而来的。由于没有重新修改 __metrics_path__ 和 __scheme__ 标签,所以默认的抓取目标就是通过 HTTP 端点 /metrics 进行抓取。
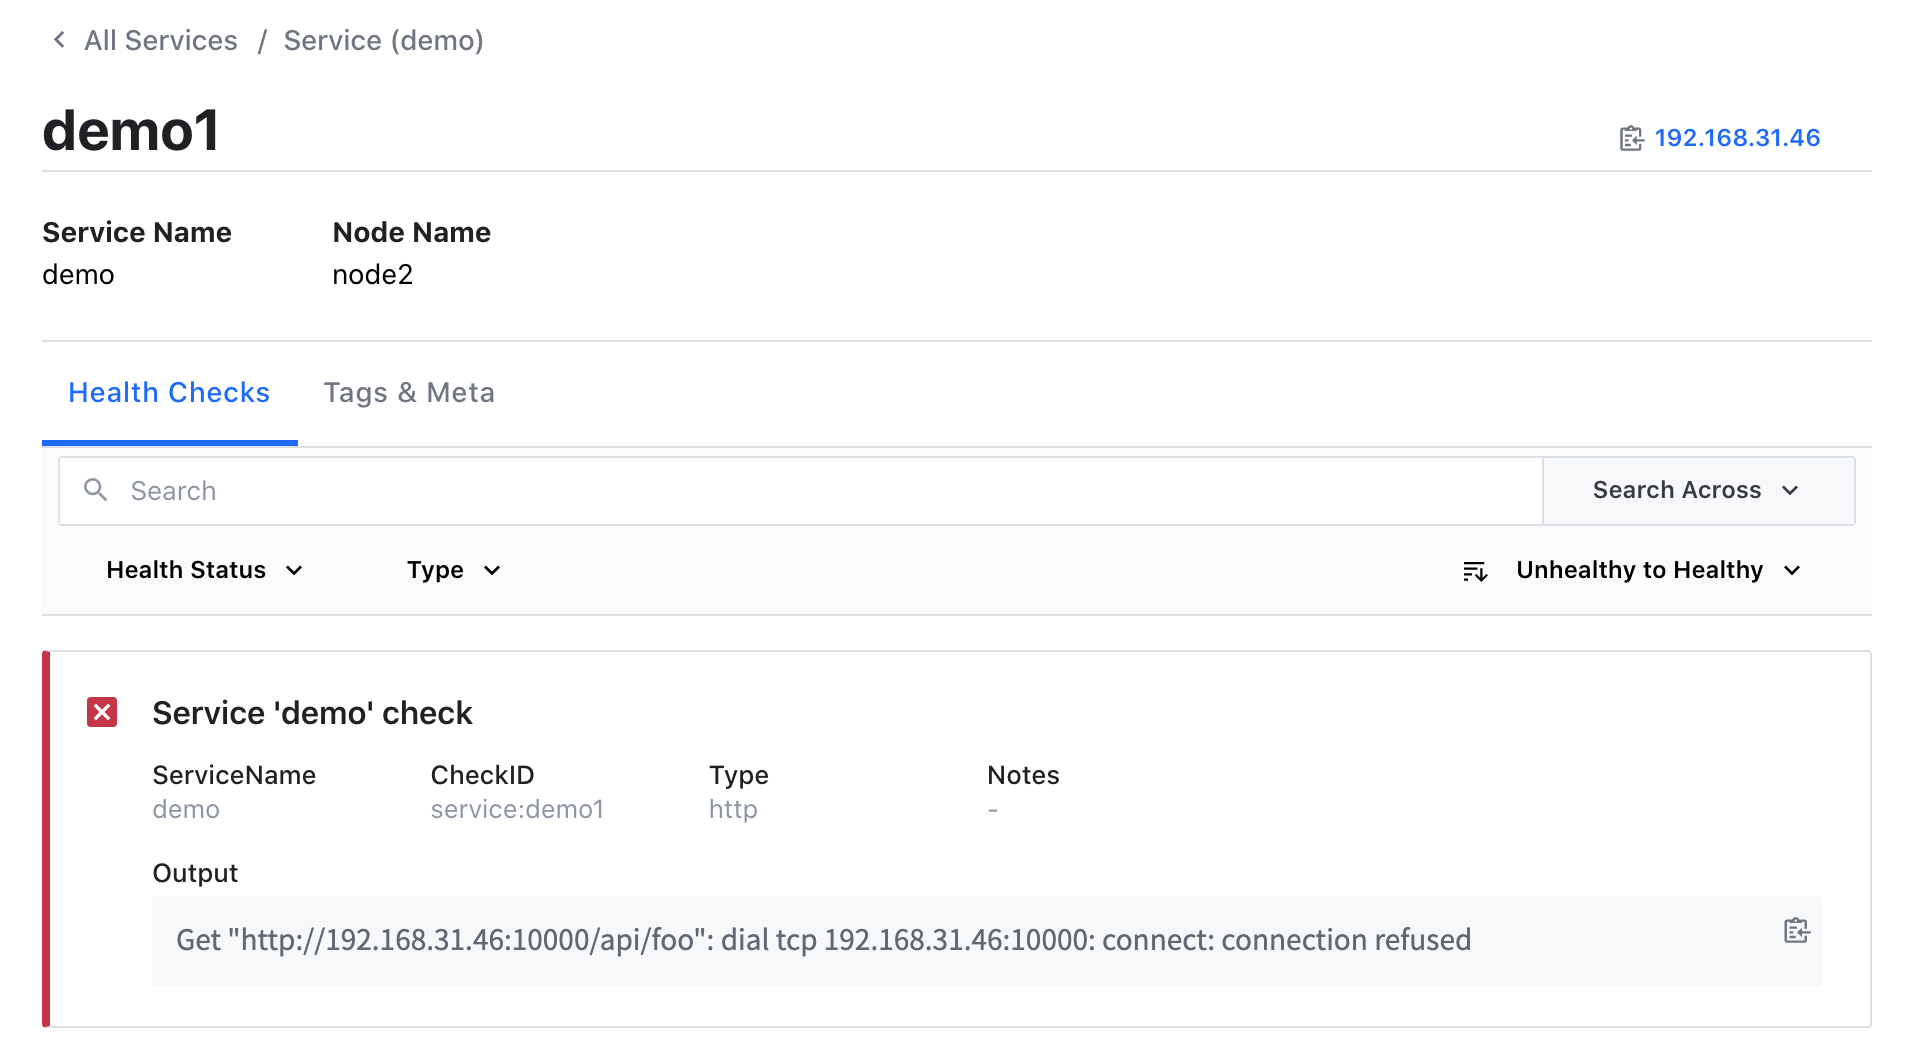
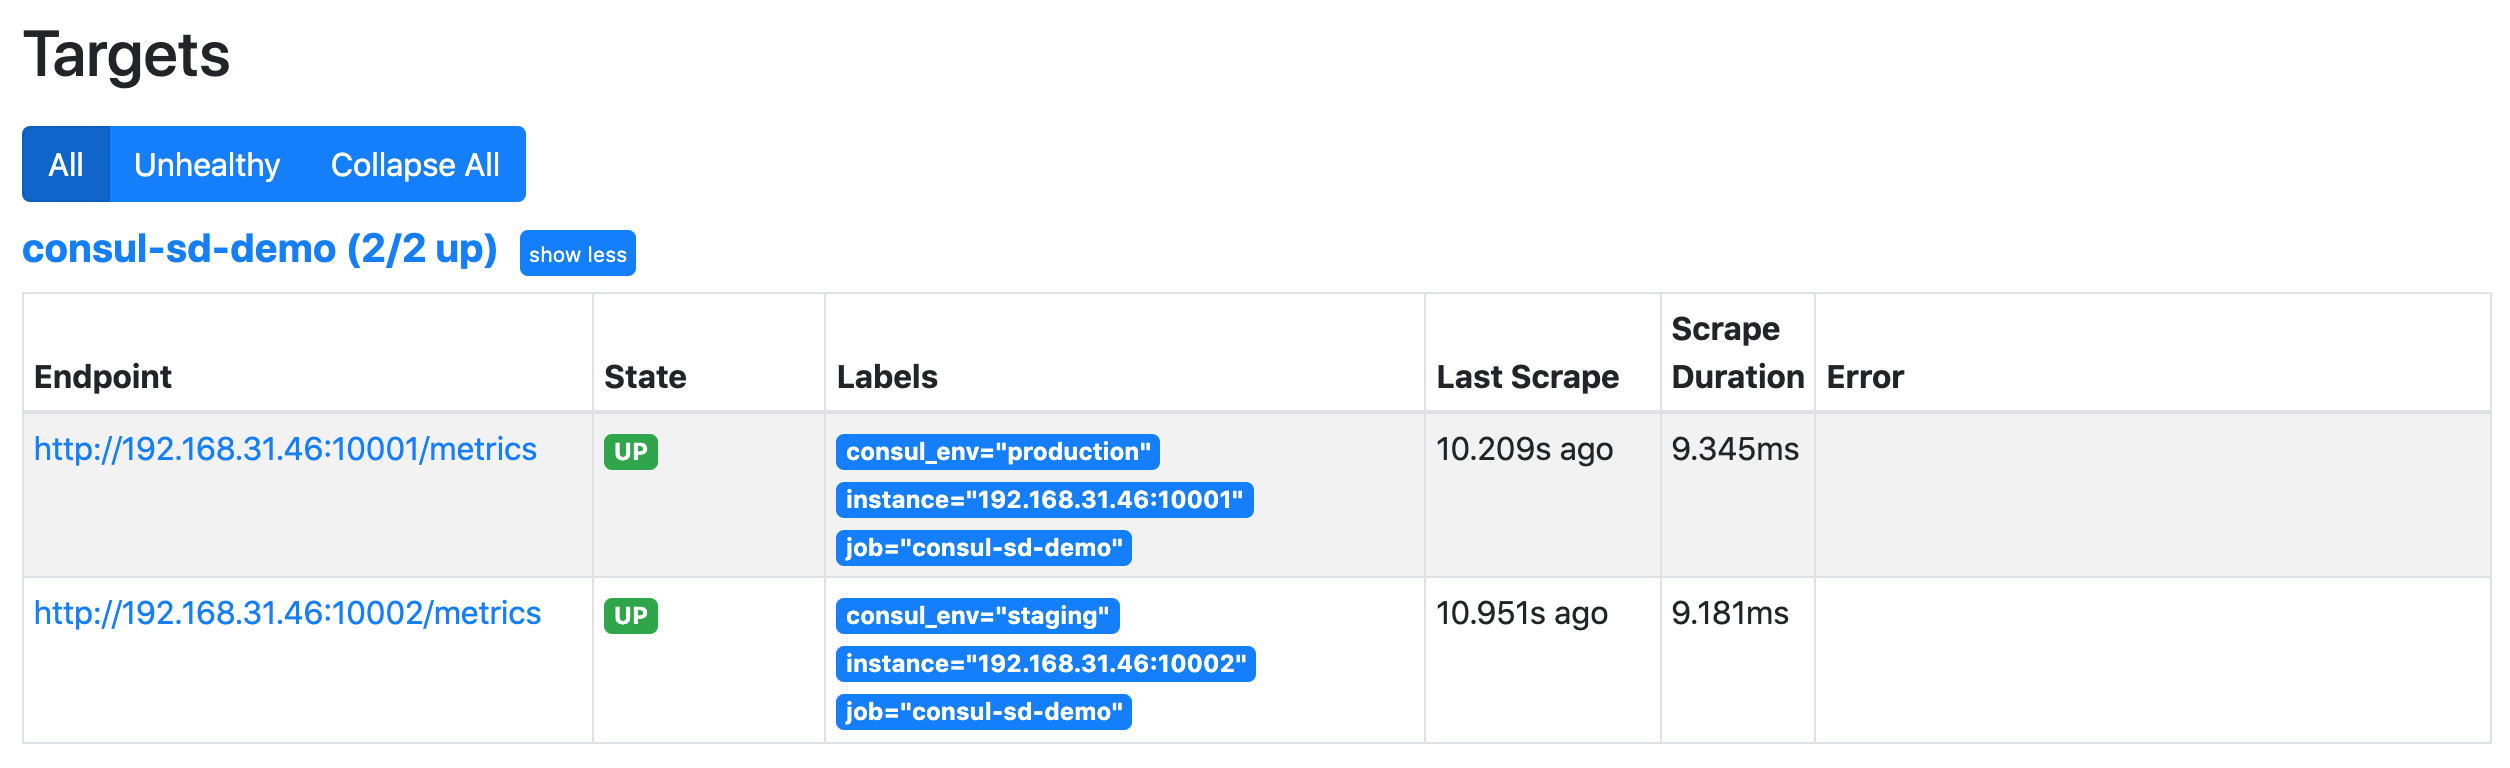
现在如果我们将 demo1 这个服务杀掉,则在 Consul 中注册的服务就会出现一个不健康的实例:
当然此时 Prometheus 中就只剩下两个正常 demo 服务的实例了:
当服务正常后就又可以自动发现对应的服务了。这样我们就完成了 Prometheus 基于 Consul 的一个简单的自动发现配置
3.5.2 基于文件的服务发现
除了基于 Consul 的服务发现之外,Prometheus 也允许我们进行自定义的发现集成,可以通过 watch 一组本地文件来获取抓取目标以及标签信息,也就是我们常说的基于文件的服务发现方式。
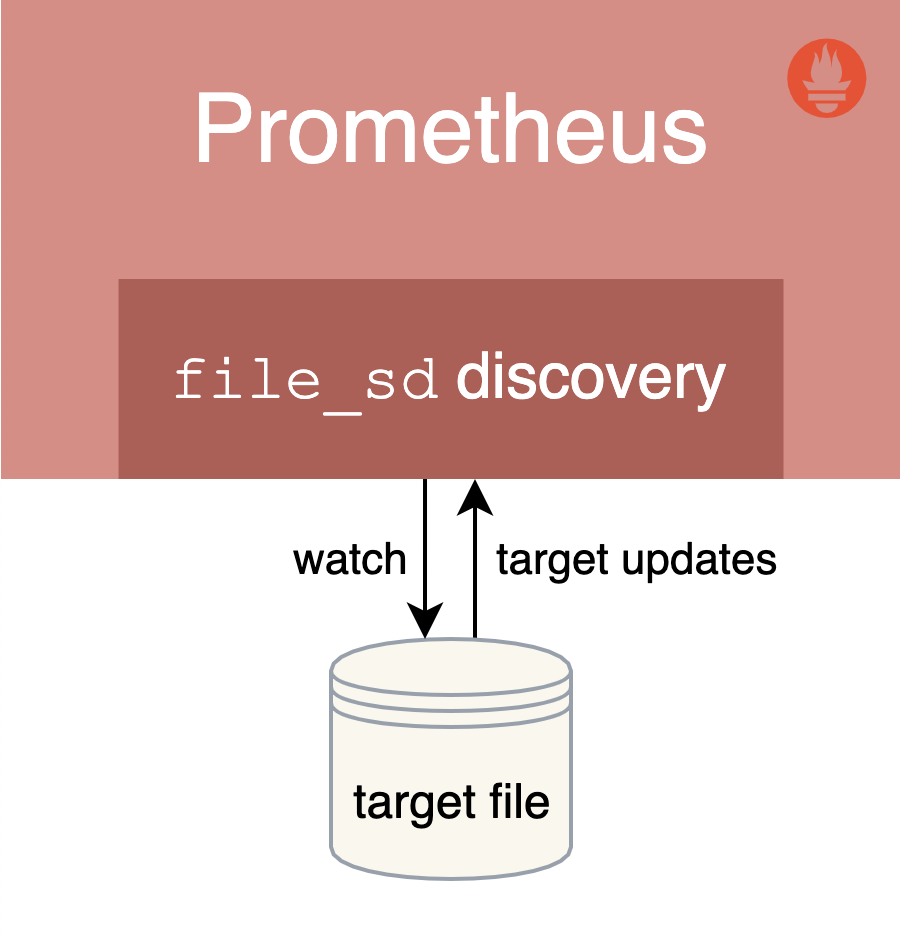
基于文件的服务发现提供了一种更通用的方式来配置静态目标,并作为一个接口插入自定义服务发现机制。
它读取一组包含零个或多个 <static_config> 列表的文件,对所有定义的文件的变更通过磁盘监视被检测到并立即应用,文件可以以 YAML 或 JSON 格式提供。文件必须包含一个静态配置的列表:
JSON json [ { "targets": [ "<host>", ... ], "labels": { "<labelname>": "<labelvalue>", ... } }, ... ]

YAML yaml - targets: [ - '<host>' ] labels: [ <labelname>: <labelvalue> ... ]
文件内容也会在指定的刷新间隔时间内定期重新读取。
# Patterns for files from which target groups are extracted.
files:
  [ - <filename_pattern> ... ]

# Refresh interval to re-read the files.
[ refresh_interval: <duration> | default = 5m ]
其中 <filename*pattern> 可以是一个以 .json、.yml 或 .yaml 结尾的路径,最后一个路径段可以包含一个匹配任何字符序列的 *,例如:my/path/tg_*.json。
3.5.2.1 创建文件
接下来我们来创建一个用于服务发现的目标文件,在与 prometheus.yml 文件相同目录下面创建一个名为 targets.yml 的文件,内容如下所示:
- targets:
    - "192.168.31.46:10000"
    - "192.168.31.46:10001"
  labels:
    env: production
- targets:
    - "192.168.31.46:10002"
  labels:
    env: staging
该文件中我们列举了 3 个 demo 服务实例,给前两个实例添加上了 env=production 的标签,后面一个加上了 env=staging 的标签,当然该文件也可以使用 JSON 格式进行配置:
[
  {
    "targets": [ "<host>", ... ],
    "labels": {
      "<labelname>": "<labelvalue>", ...
    }
  },
  ...
]
如果是 YAML 文件则格式为:
- targets:
  [ - '<host>' ]
  labels:
    [ <labelname>: <labelvalue> ... ]
3.5.2.2 配置文件服务发现
用于发现的目标文件创建完成后,要让 Prometheus 能够从上面的 targets.yml 文件中自动读取抓取目标,需要在 prometheus.yml 配置文件中的 scrape_configs 部分添加如下所示的抓取配置:
- job_name: "file-sd-demo"
  file_sd_configs:
    - files:
        - "targets.yml"
重新 reload 或者重启下 Prometheus 让其重新读取配置文件信息,然后同样前往 Prometheus UI 的 targets 页面下面查看是否有上面定义的抓取目标。
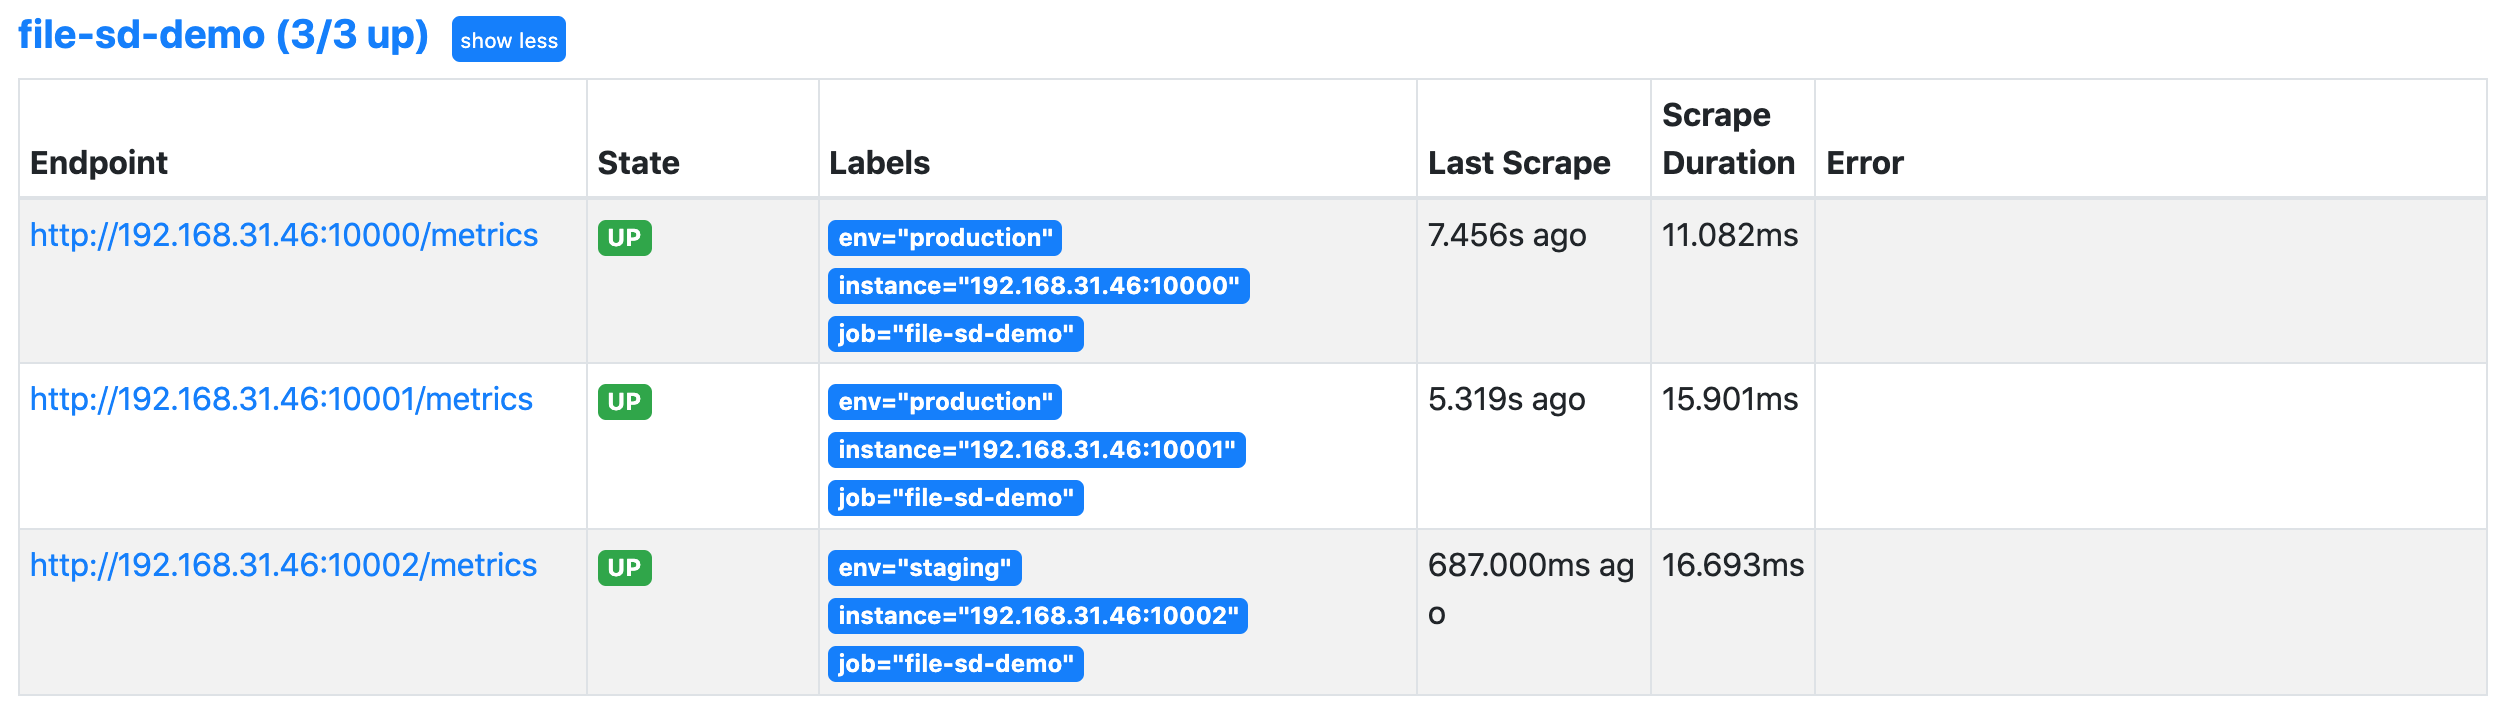
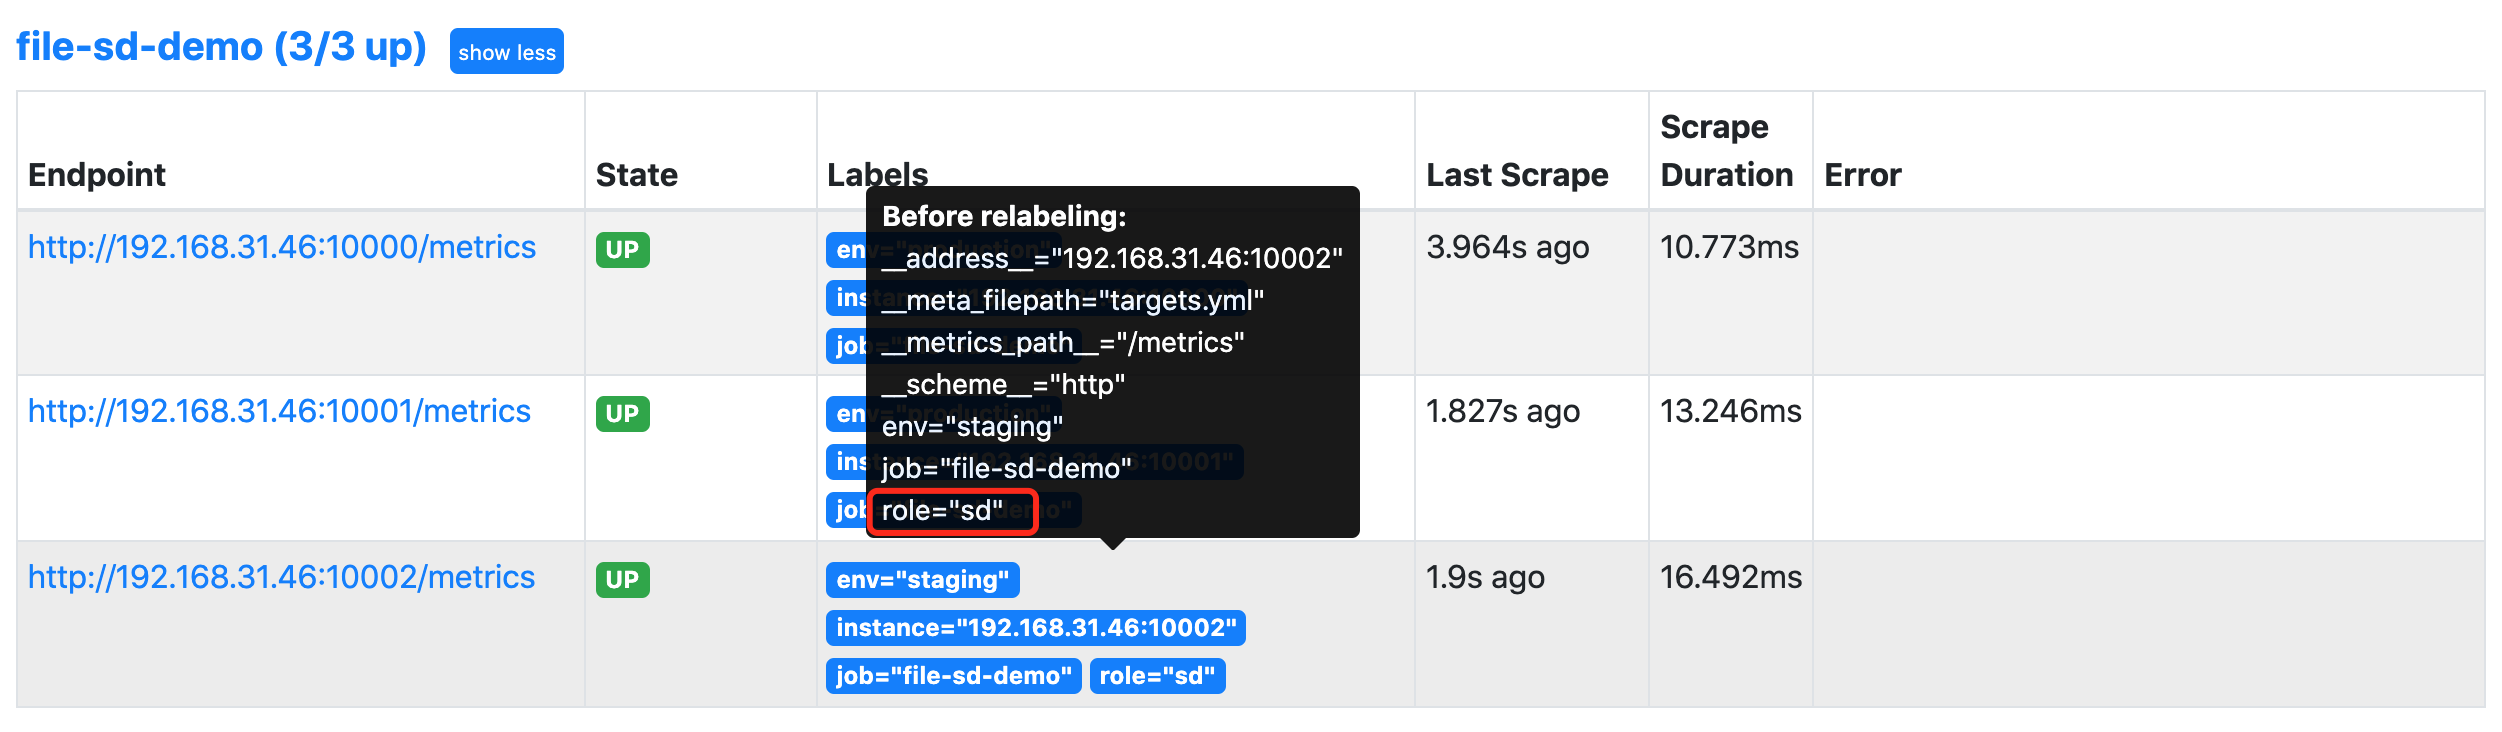
然后我们可以尝试改变 targets.yml 的内容,比如为第三个实例增加一个 role: sd 的标签,不用重新加载 Prometheus 配置,Prometheus 将 watch 该文件,并自动接收任何变化。
注意:当在生产环境 Prometheus 服务器中改变
file_sd目标文件时,确保改变是原子的,以避免重新加载出现错误,最好的方法是在一个单独的位置创建更新的文件,然后将其重命名为目标文件名(使用mv命令或rename()系统调用)。
这样我们就完成了基于文件的通用服务发现机制,可以让我们动态地改变 Prometheus 的监控目标,而不需要重新启动或重新加载 Prometheus 服务。当然除了基于 Consul 和文件的服务发现之外,更多的时候我们会在 Kubernetes 环境下面使用 Prometheus。
3.6 监控mysql数据库指标
3.6.1 安装数据库
[root@node ~]# yum -y install mariadb-server
[root@node ~]# systemctl enable --now mariadb

##授权mysql_exporter能连接数据库收集数据
[root@node ~]# mysql
MariaDB [(none)]> grant all privileges on *.* to mysql_exporter@'localhost' identified by '123456';

MariaDB [(none)]> flush privileges;


##创建.my.cnf文件,在配置文件中加入
[root@node mysqld_exporter]# vim .my.cnf
[root@node mysqld_exporter]# cat .my.cnf
[client]
user=mysql_exporter
password=123456
3.6.2 安装 mysqld_exporter
[root@node ~]# tar zxvf mysqld_exporter-0.13.0.linux-amd64.tar.gz -C /usr/local/
[root@node mysqld_exporter-0.13.0.linux-amd64]# cp mysqld_exporter /usr/sbin/
3.6.3 启动mysql_exporter
##配置文件后面接上数据库的配置文件
[root@node mysqld_exporter-0.13.0.linux-amd64]# nohup ./mysqld_exporter --config.my-cnf="/usr/local/mysqld_exporter/.my.cnf" &


##查看端口9104
[root@node mysqld_exporter-0.13.0.linux-amd64]# netstat -antup|grep 9104
tcp6       0      0 :::9104                 :::*                    LISTEN      13560/./mysqld_expo
[root@node mysqld_exporter-0.13.0.linux-amd64]#
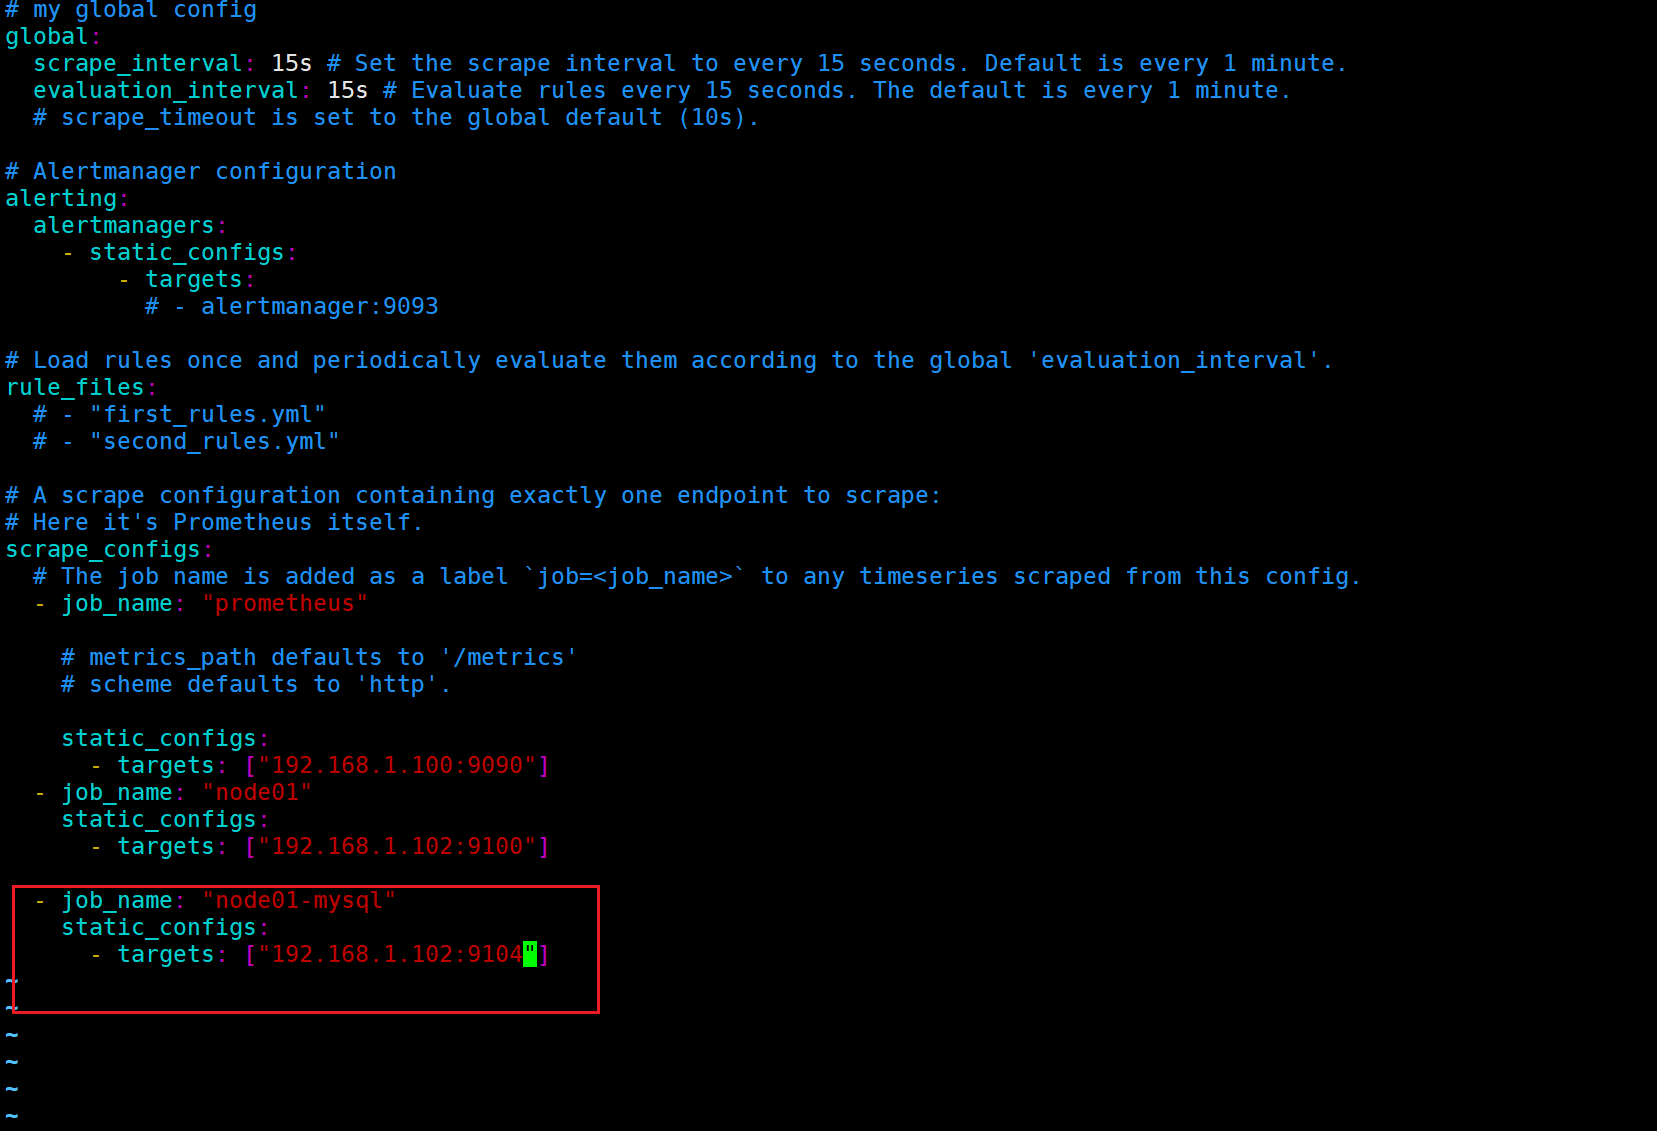
3.6.4 编辑prometheus的配置文件,添加新监控项
3.6.5 重启Prometheus
[root@prometheus_server prometheus]# nohup prometheus --config.file "/etc/prometheus/prometheus.yml" &
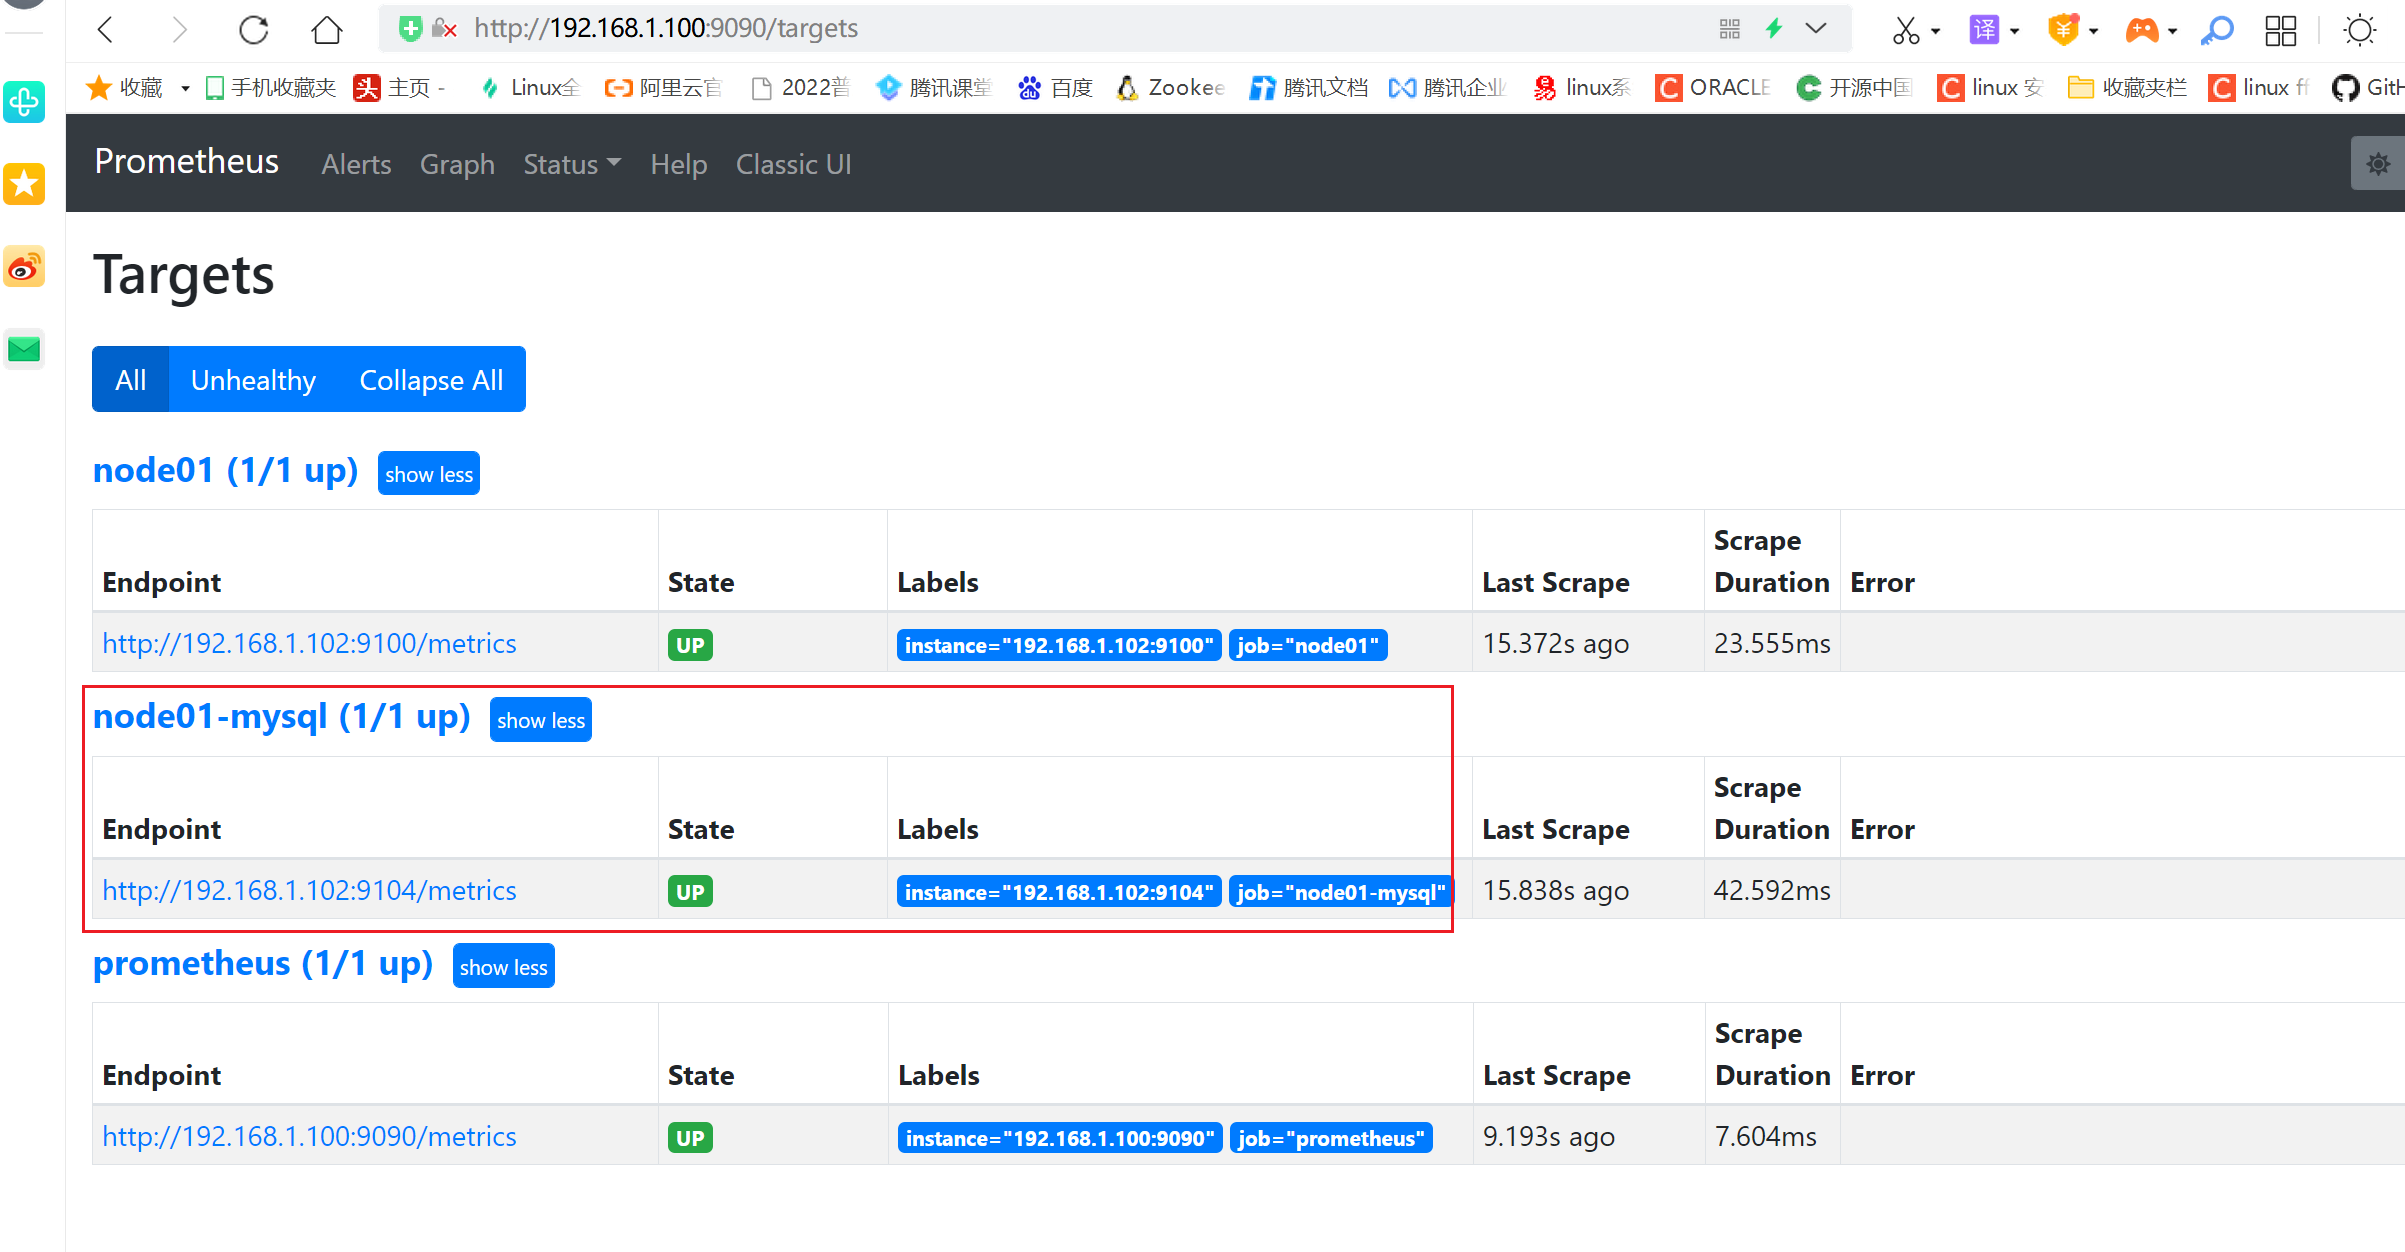
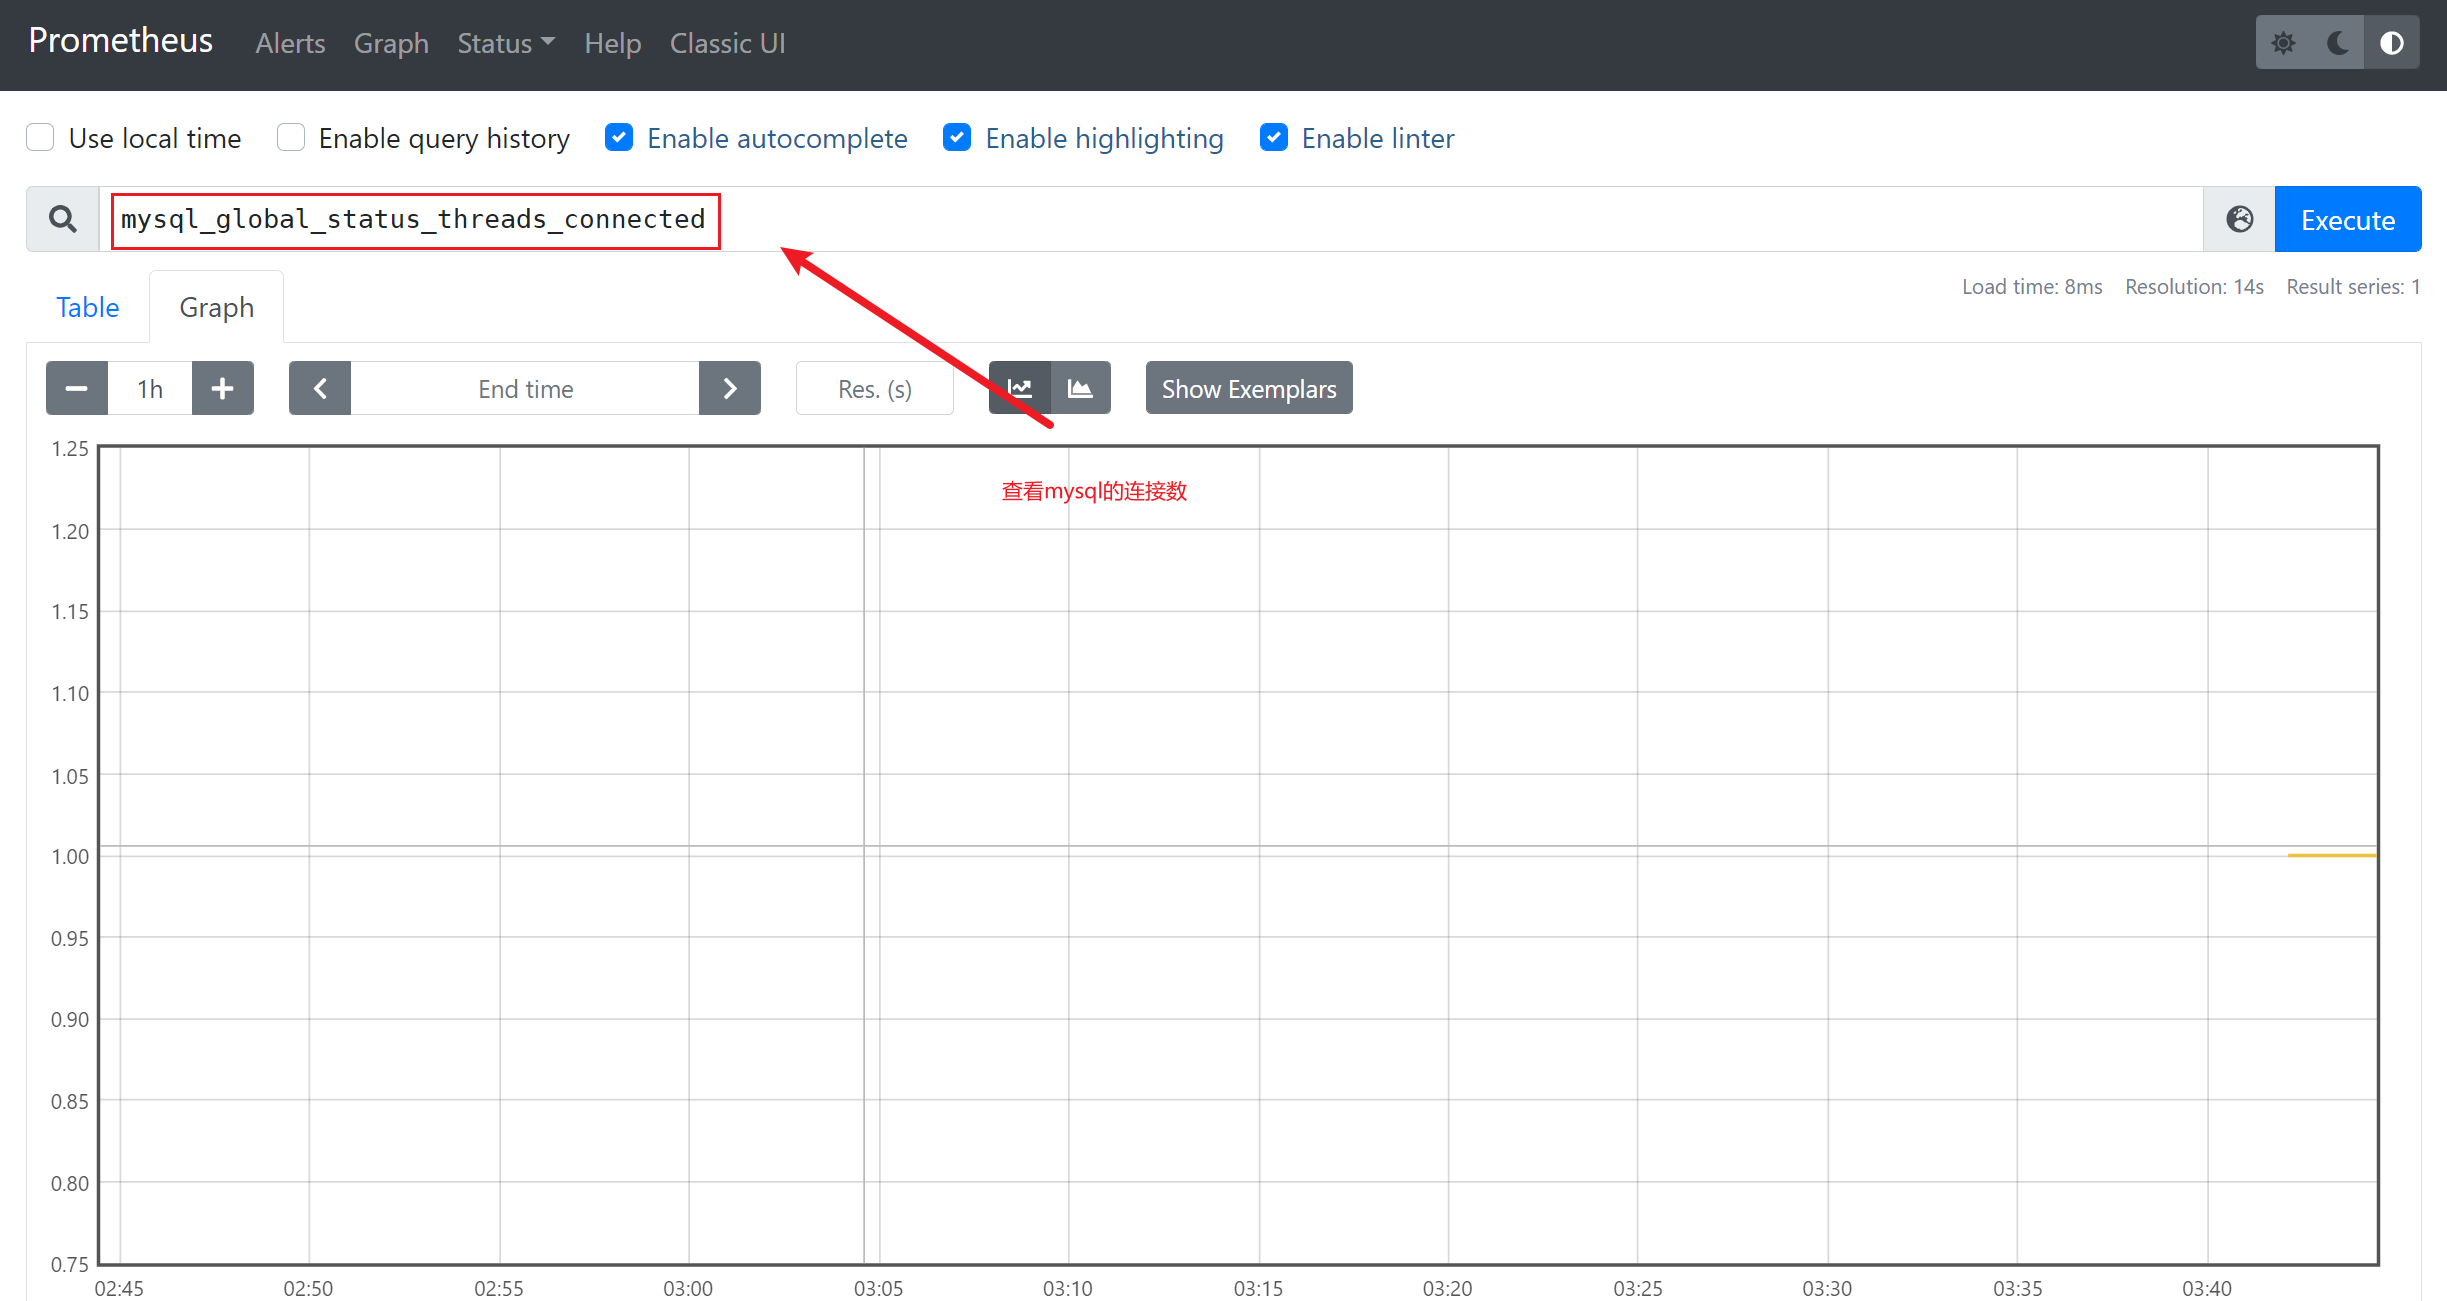
3.6.6 查看监控
3.7 数据可视化
https://grafana.com/grafana/
Grafana是一款用Go语言开发的开源数据可视化工具,可以做数据监控和数据统计,带有告警功能。目前使用grafana的公司有很多,如paypal、ebay、intel等
prometheus自身也有数据展示的功能,但是并不是很专业,我们可以采用grafana这个工具帮我们进行数据的展示
3.7.1 下载grafana的安装包
##官方下载更新的版本
[root@grafana ~]# wget https://dl.grafana.com/oss/release/grafana-8.2.0-1.x86_64.rpm
[root@grafana ~]# sudo yum install grafana-8.2.0-1.x86_64.rpm


##或者在国内的yum源站中下载
[root@grafana ~]# rpm -ivh https://mirrors.tuna.tsinghua.edu.cn/grafana/yum/el7/grafana-5.4.2-1.x86_64.rpm
Retrieving https://mirrors.tuna.tsinghua.edu.cn/grafana/yum/el7/grafana-5.4.2-1.x86_64.rpm
warning: /var/tmp/rpm-tmp.0Js7ji: Header V4 RSA/SHA1 Signature, key ID 24098cb6: NOKEY
Preparing...                          ################################# [100%]
Updating / installing...
   1:grafana-5.4.2-1                  ################################# [100%]
### NOT starting on installation, please execute the following statements to configure grafana to start automatically using systemd
 sudo /bin/systemctl daemon-reload
 sudo /bin/systemctl enable grafana-server.service
### You can start grafana-server by executing
 sudo /bin/systemctl start grafana-server.service
POSTTRANS: Running script
[root@grafana ~]#

##如果安装报错,请先安装依赖包。
[root@grafana-server ~]# rpm -ivh grafana-8.4.7-1.x86_64.rpm
warning: grafana-8.4.7-1.x86_64.rpm: Header V4 RSA/SHA256 Signature, key ID 24098cb6: NOKEY
error: Failed dependencies:
	fontconfig is needed by grafana-8.4.7-1.x86_64
	urw-fonts is needed by grafana-8.4.7-1.x86_64
3.7.2 启动服务
[root@grafana ~]# systemctl enable --now grafana-server
Created symlink from /etc/systemd/system/multi-user.target.wants/grafana-server.service to /usr/lib/systemd/system/grafana-server.service.
3.7.3 查看运行端口
[root@grafana ~]# netstat -antup
Active Internet connections (servers and established)
Proto Recv-Q Send-Q Local Address           Foreign Address         State       PID/Program name
tcp        0      0 0.0.0.0:22              0.0.0.0:*               LISTEN      1035/sshd
tcp        0      0 127.0.0.1:25            0.0.0.0:*               LISTEN      1172/master
tcp        0      0 192.168.1.104:22        192.168.1.1:1071        ESTABLISHED 2283/sshd: root@pts
tcp        0      0 192.168.1.104:42280     34.120.177.193:443      ESTABLISHED 12846/grafana-serve
tcp6       0      0 :::22                   :::*                    LISTEN      1035/sshd
tcp6       0      0 :::3000                 :::*                    LISTEN      12846/grafana-serve
tcp6       0      0 ::1:25                  :::*                    LISTEN      1172/master


##默认是3000端口
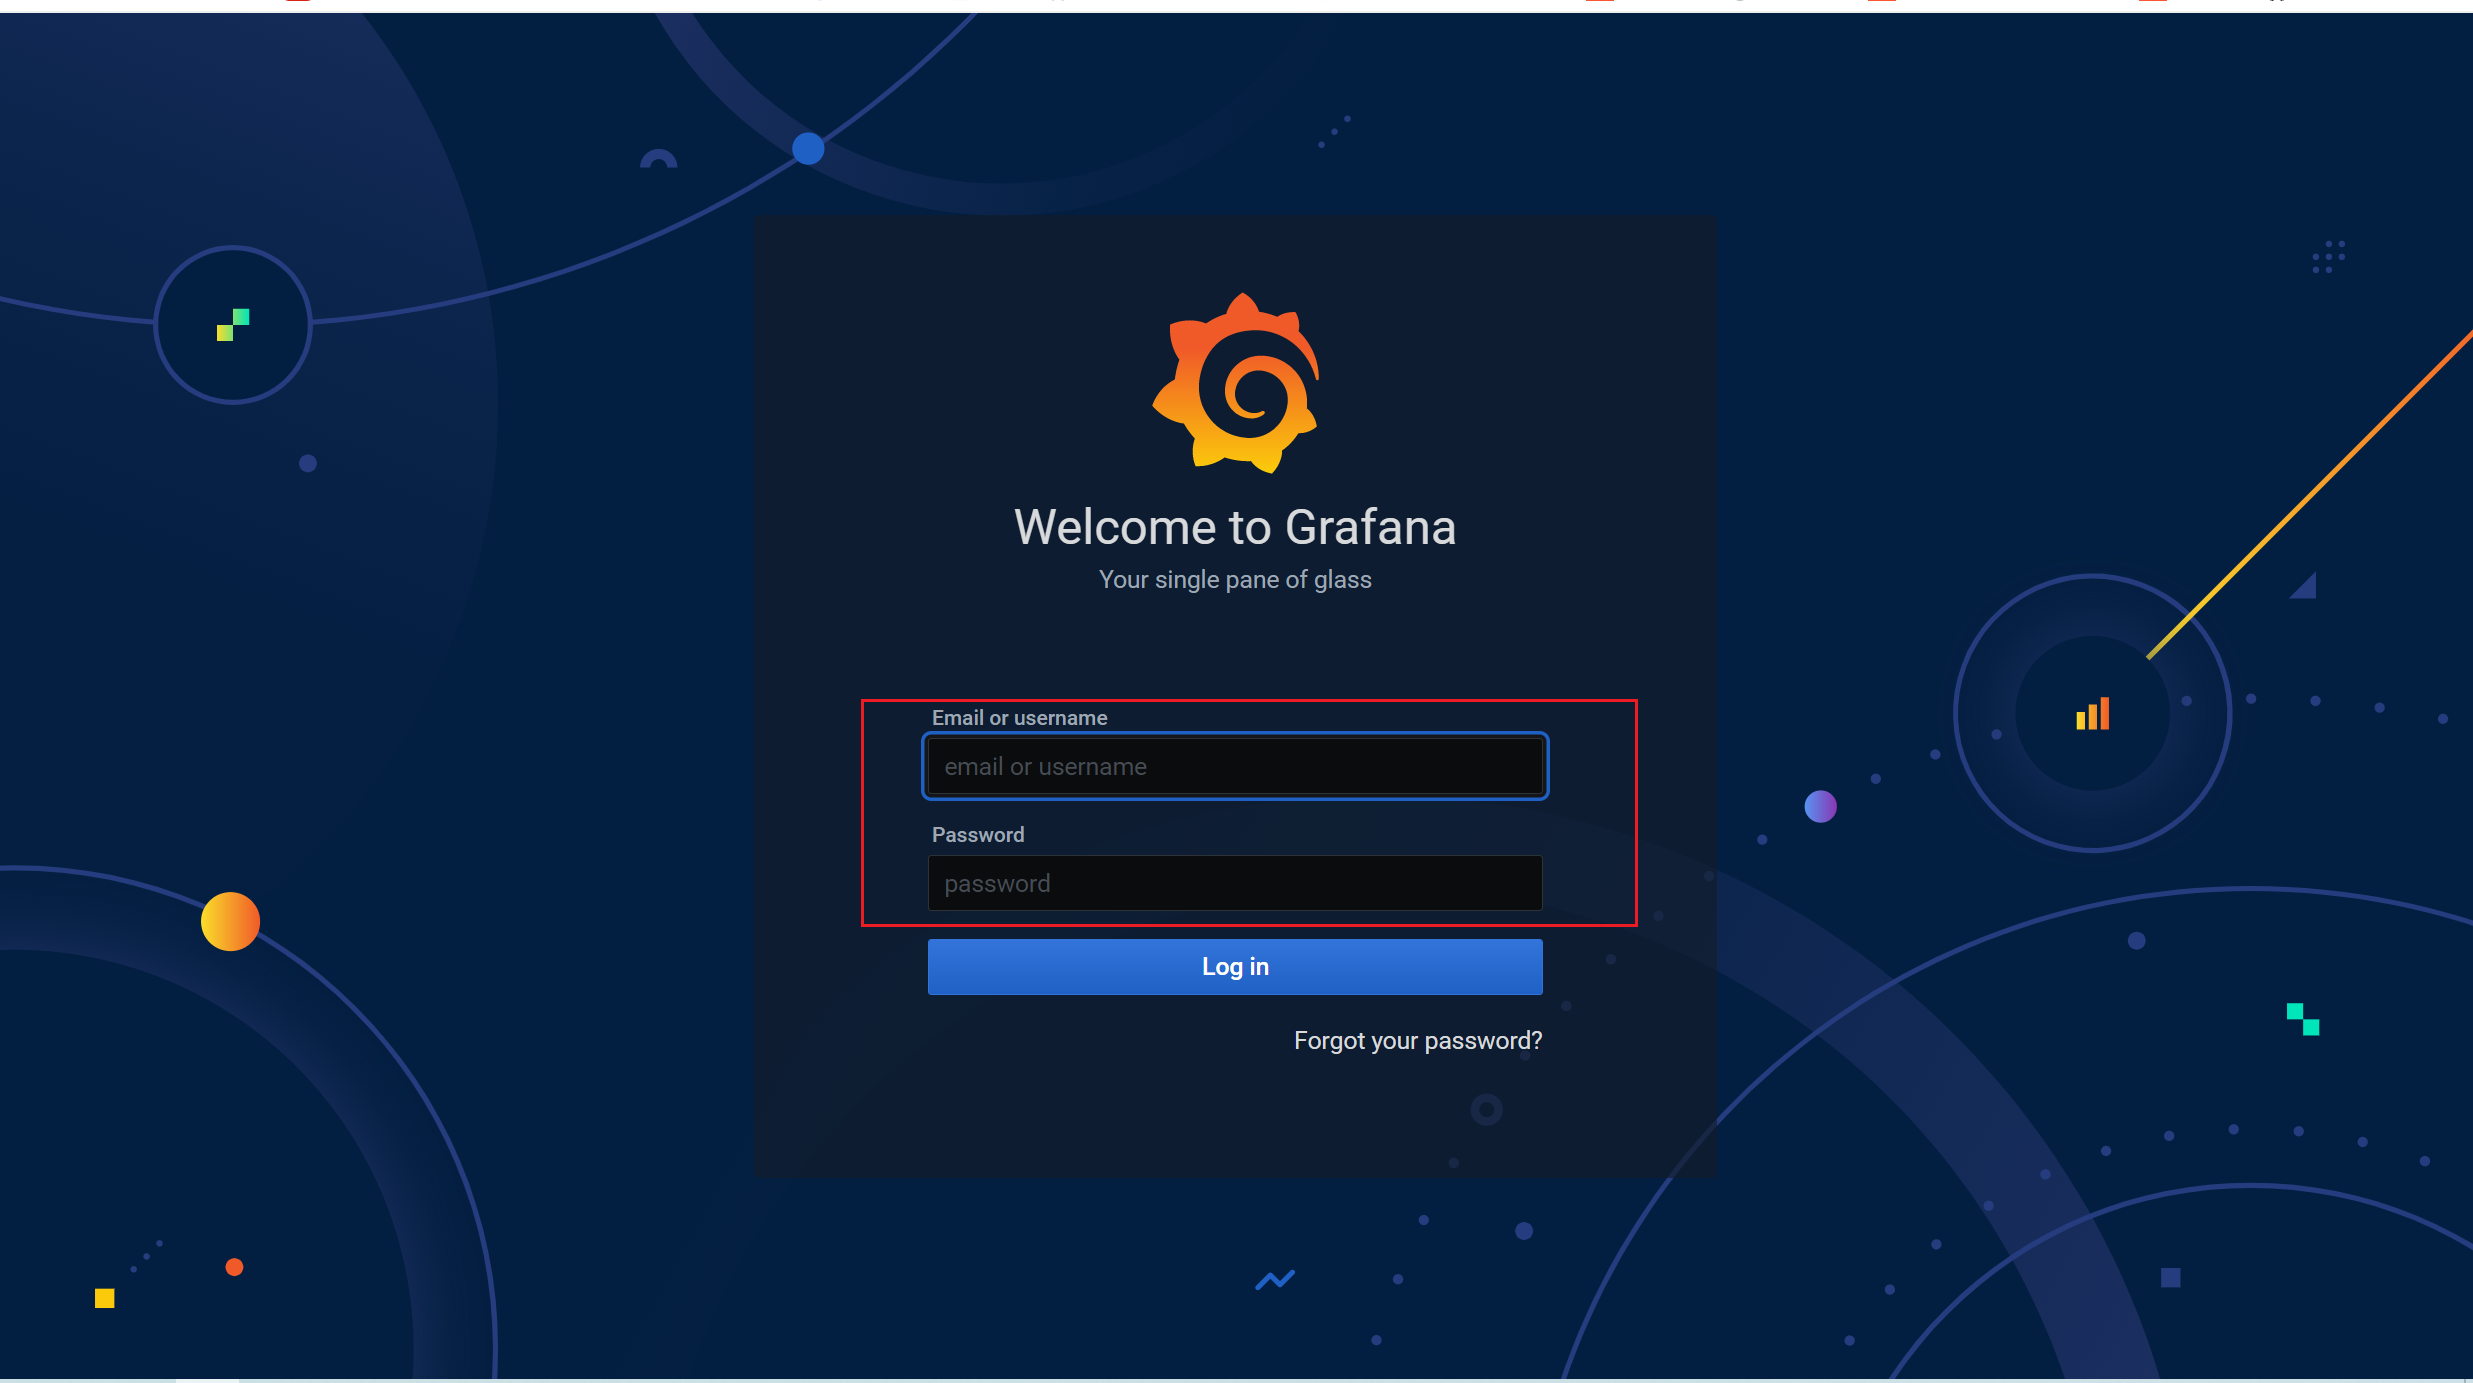
3.7.4 登录grafana
http://ip:3000

#首次登录的账号和密码都是:admin,需要修改密码
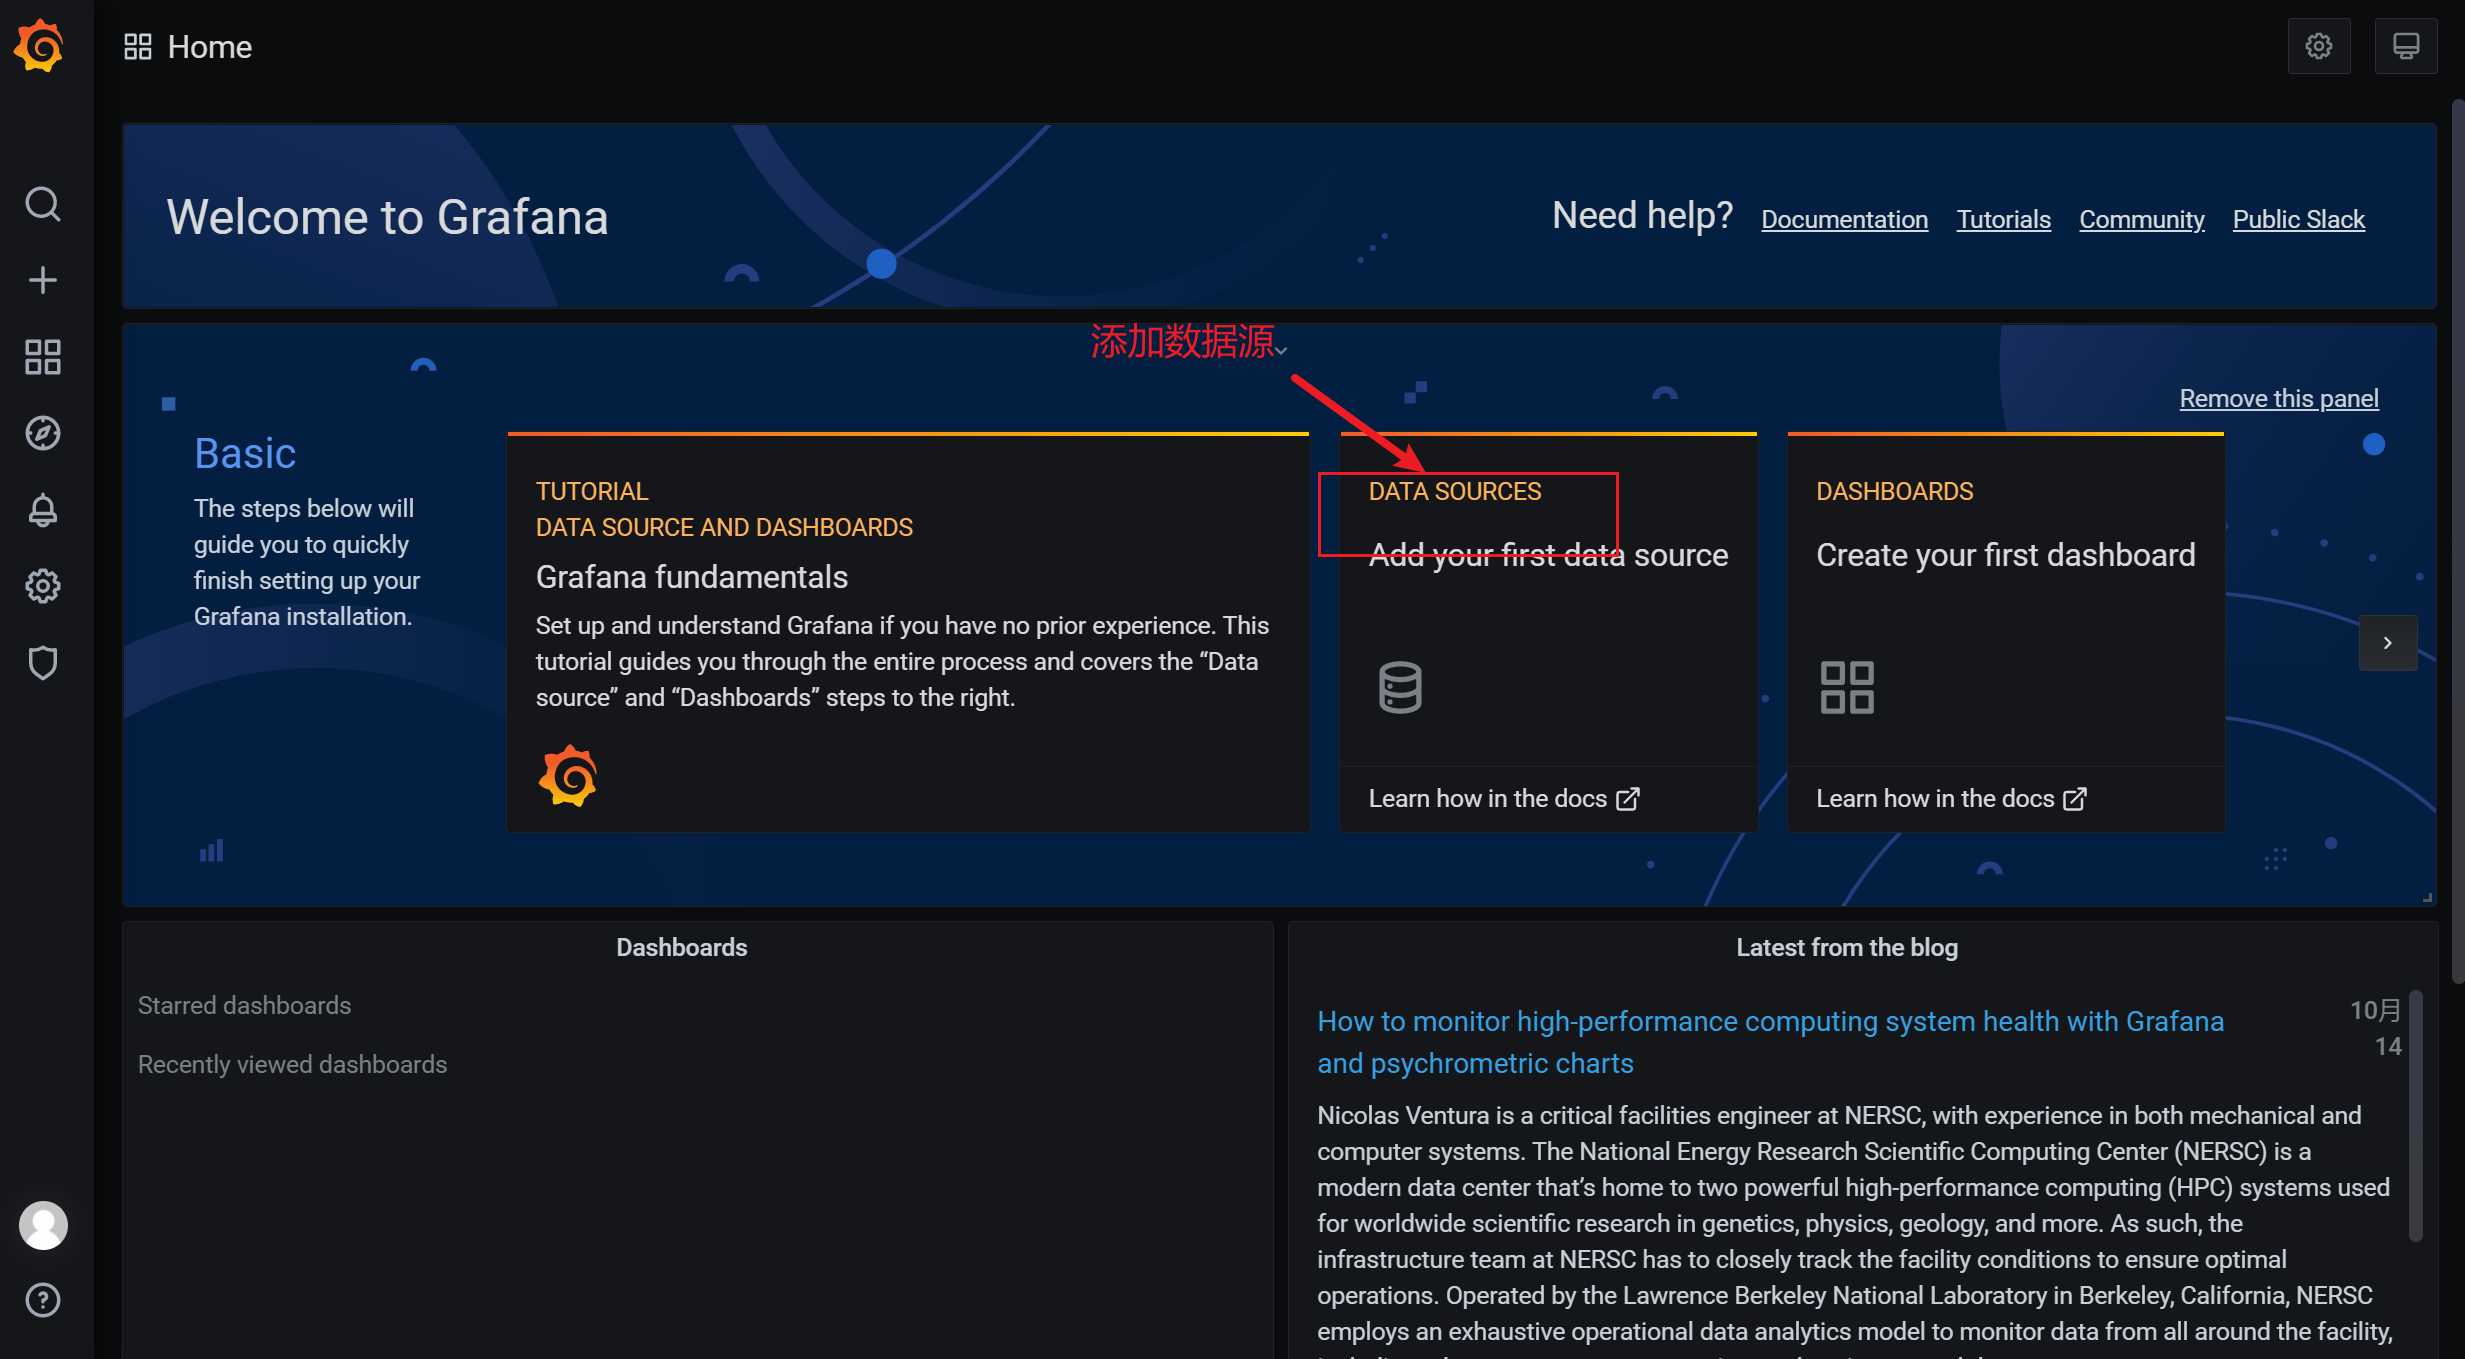
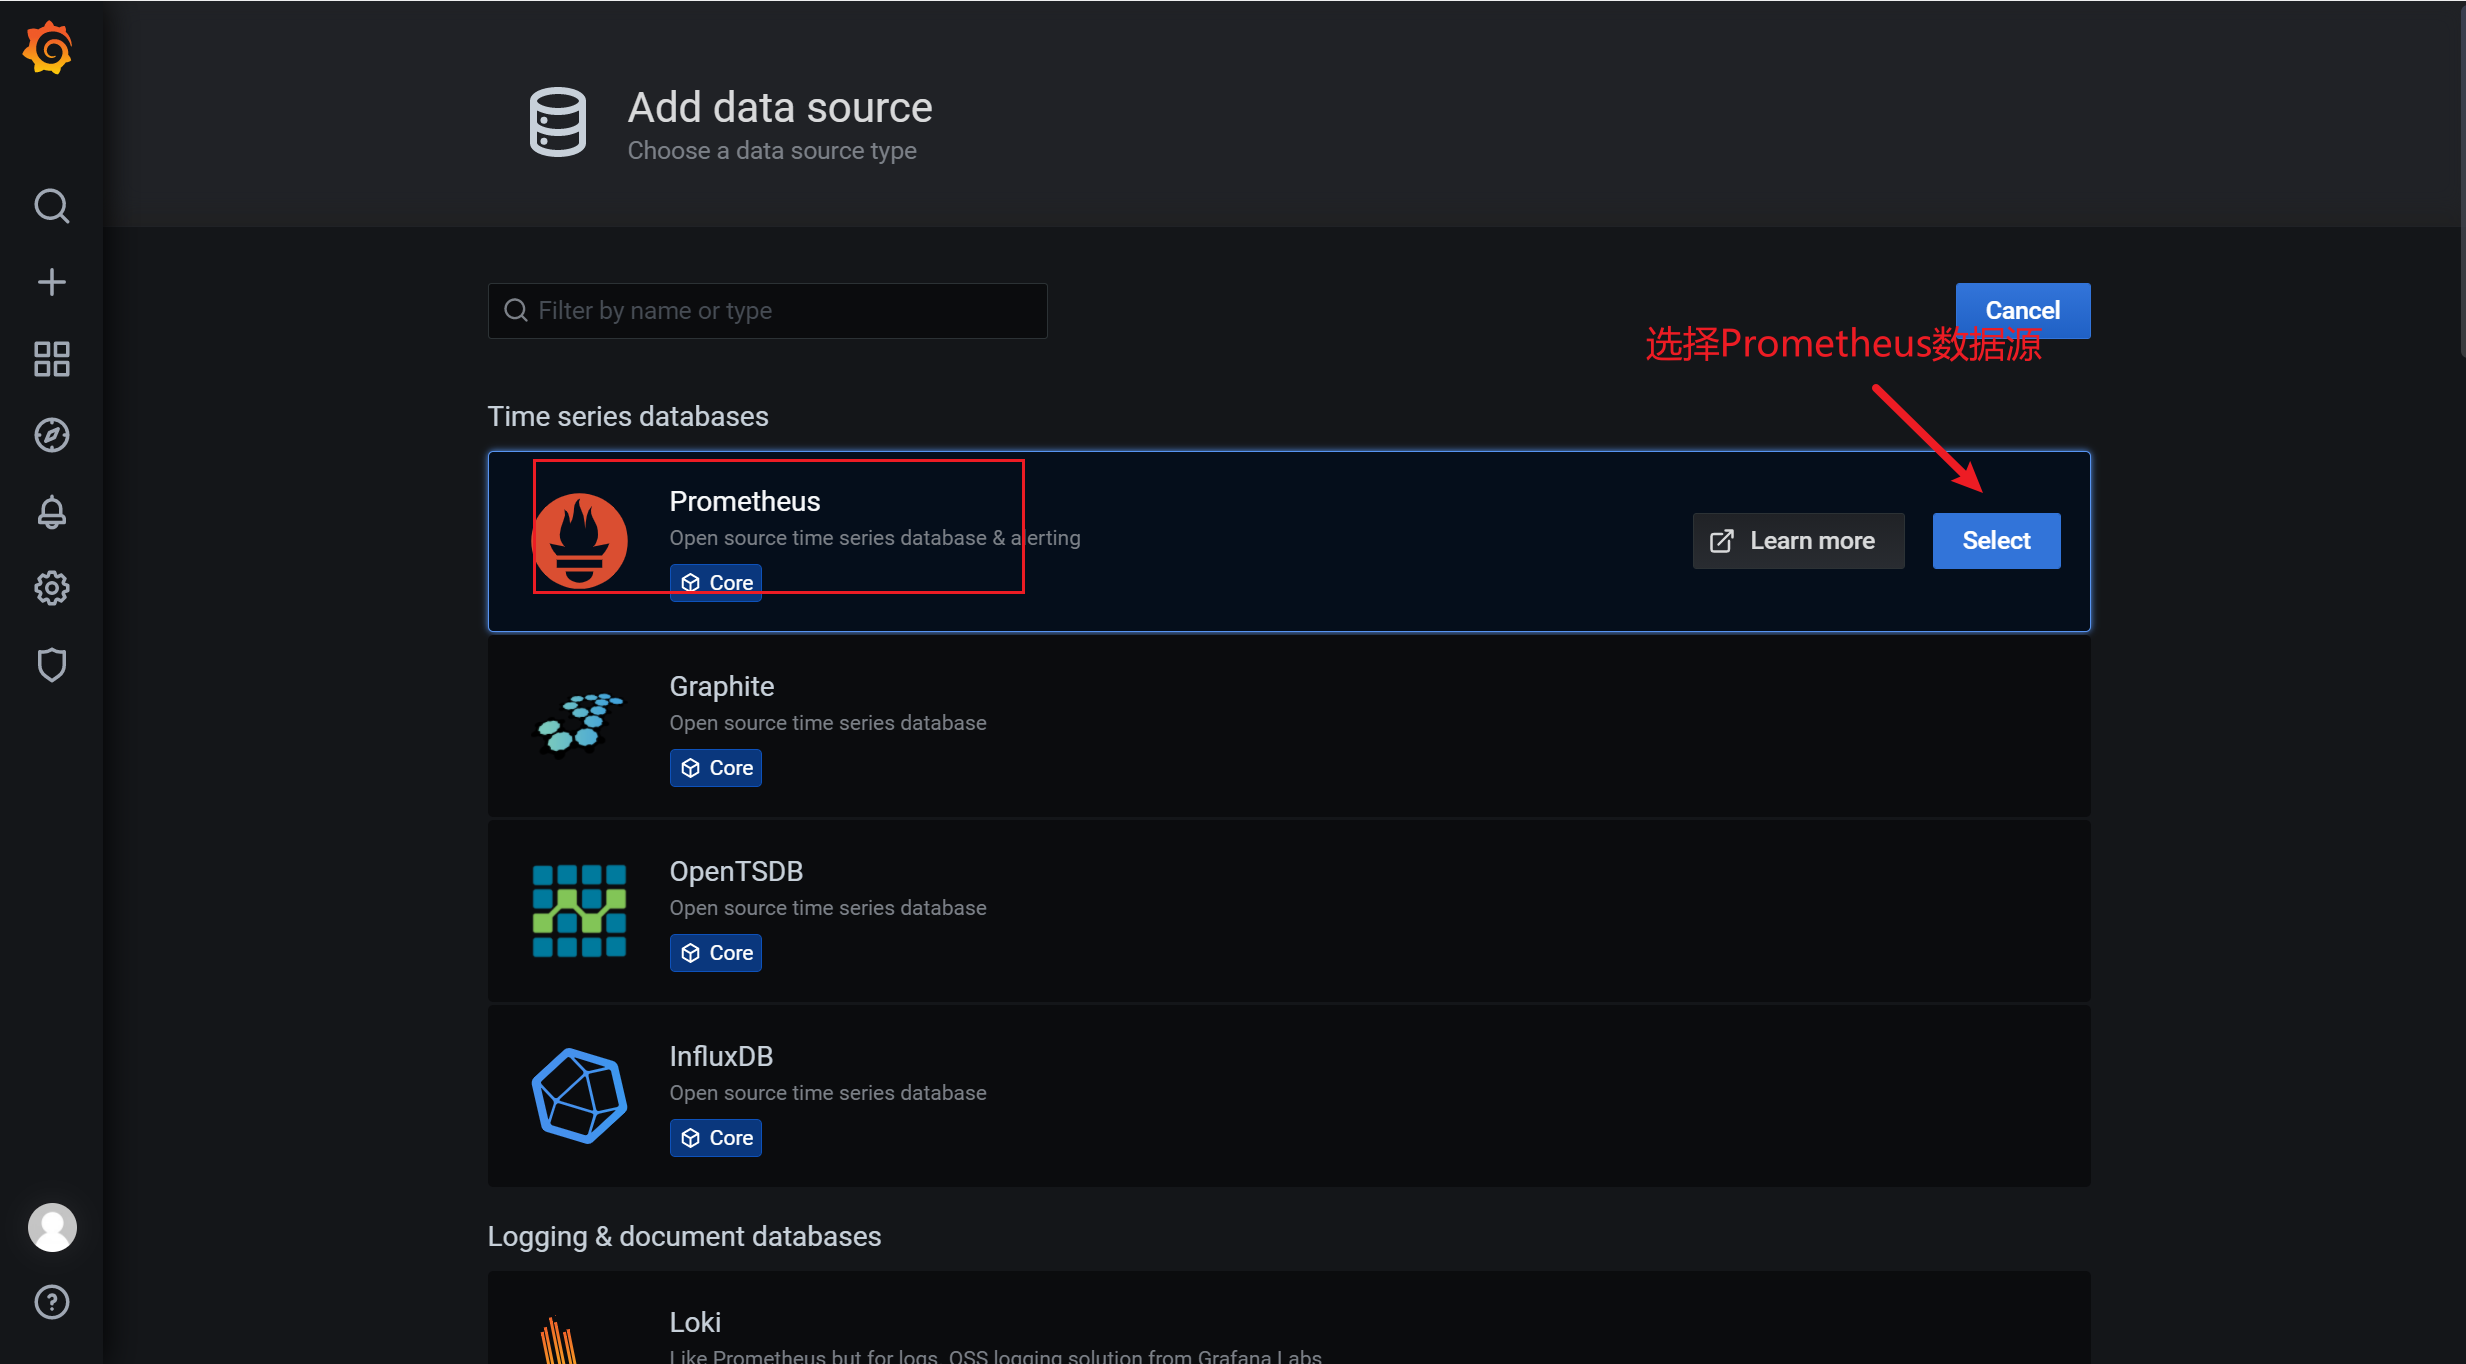
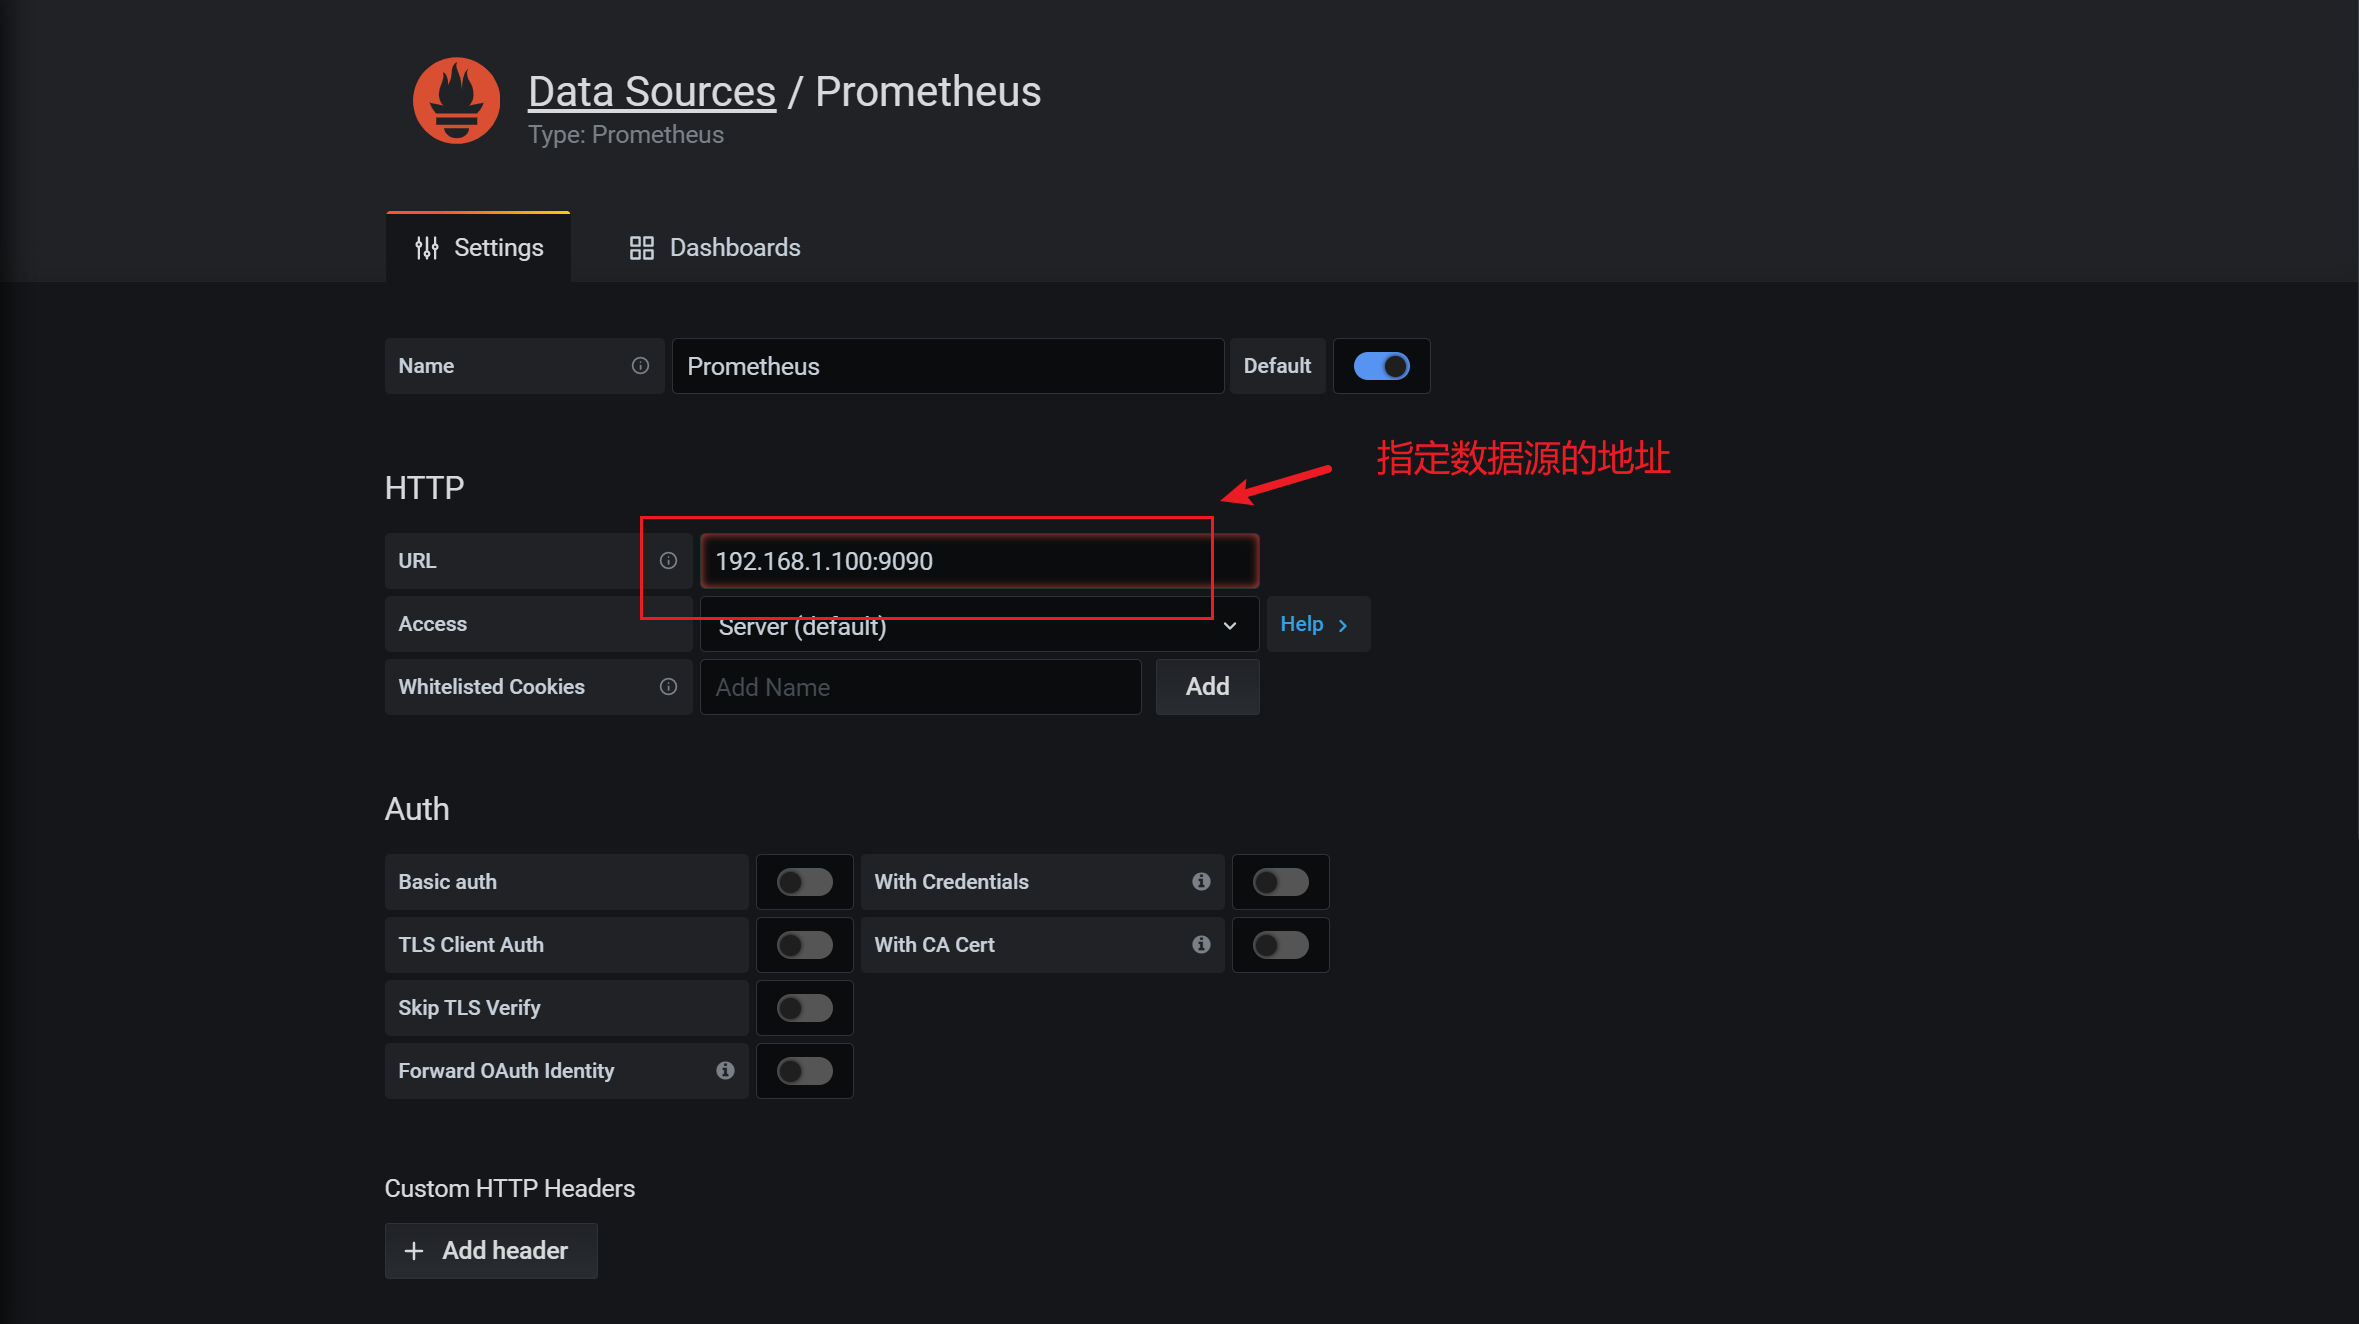
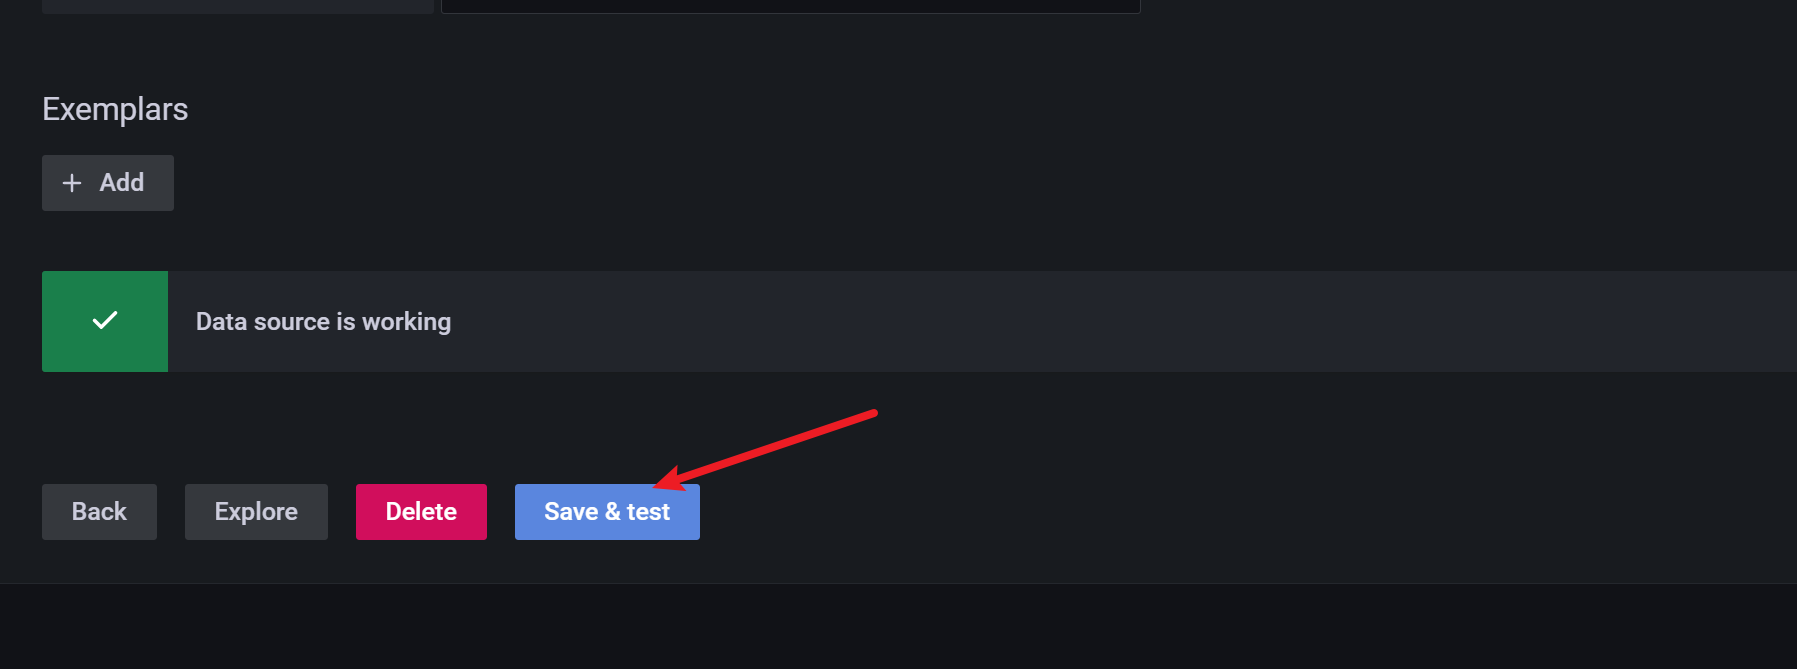
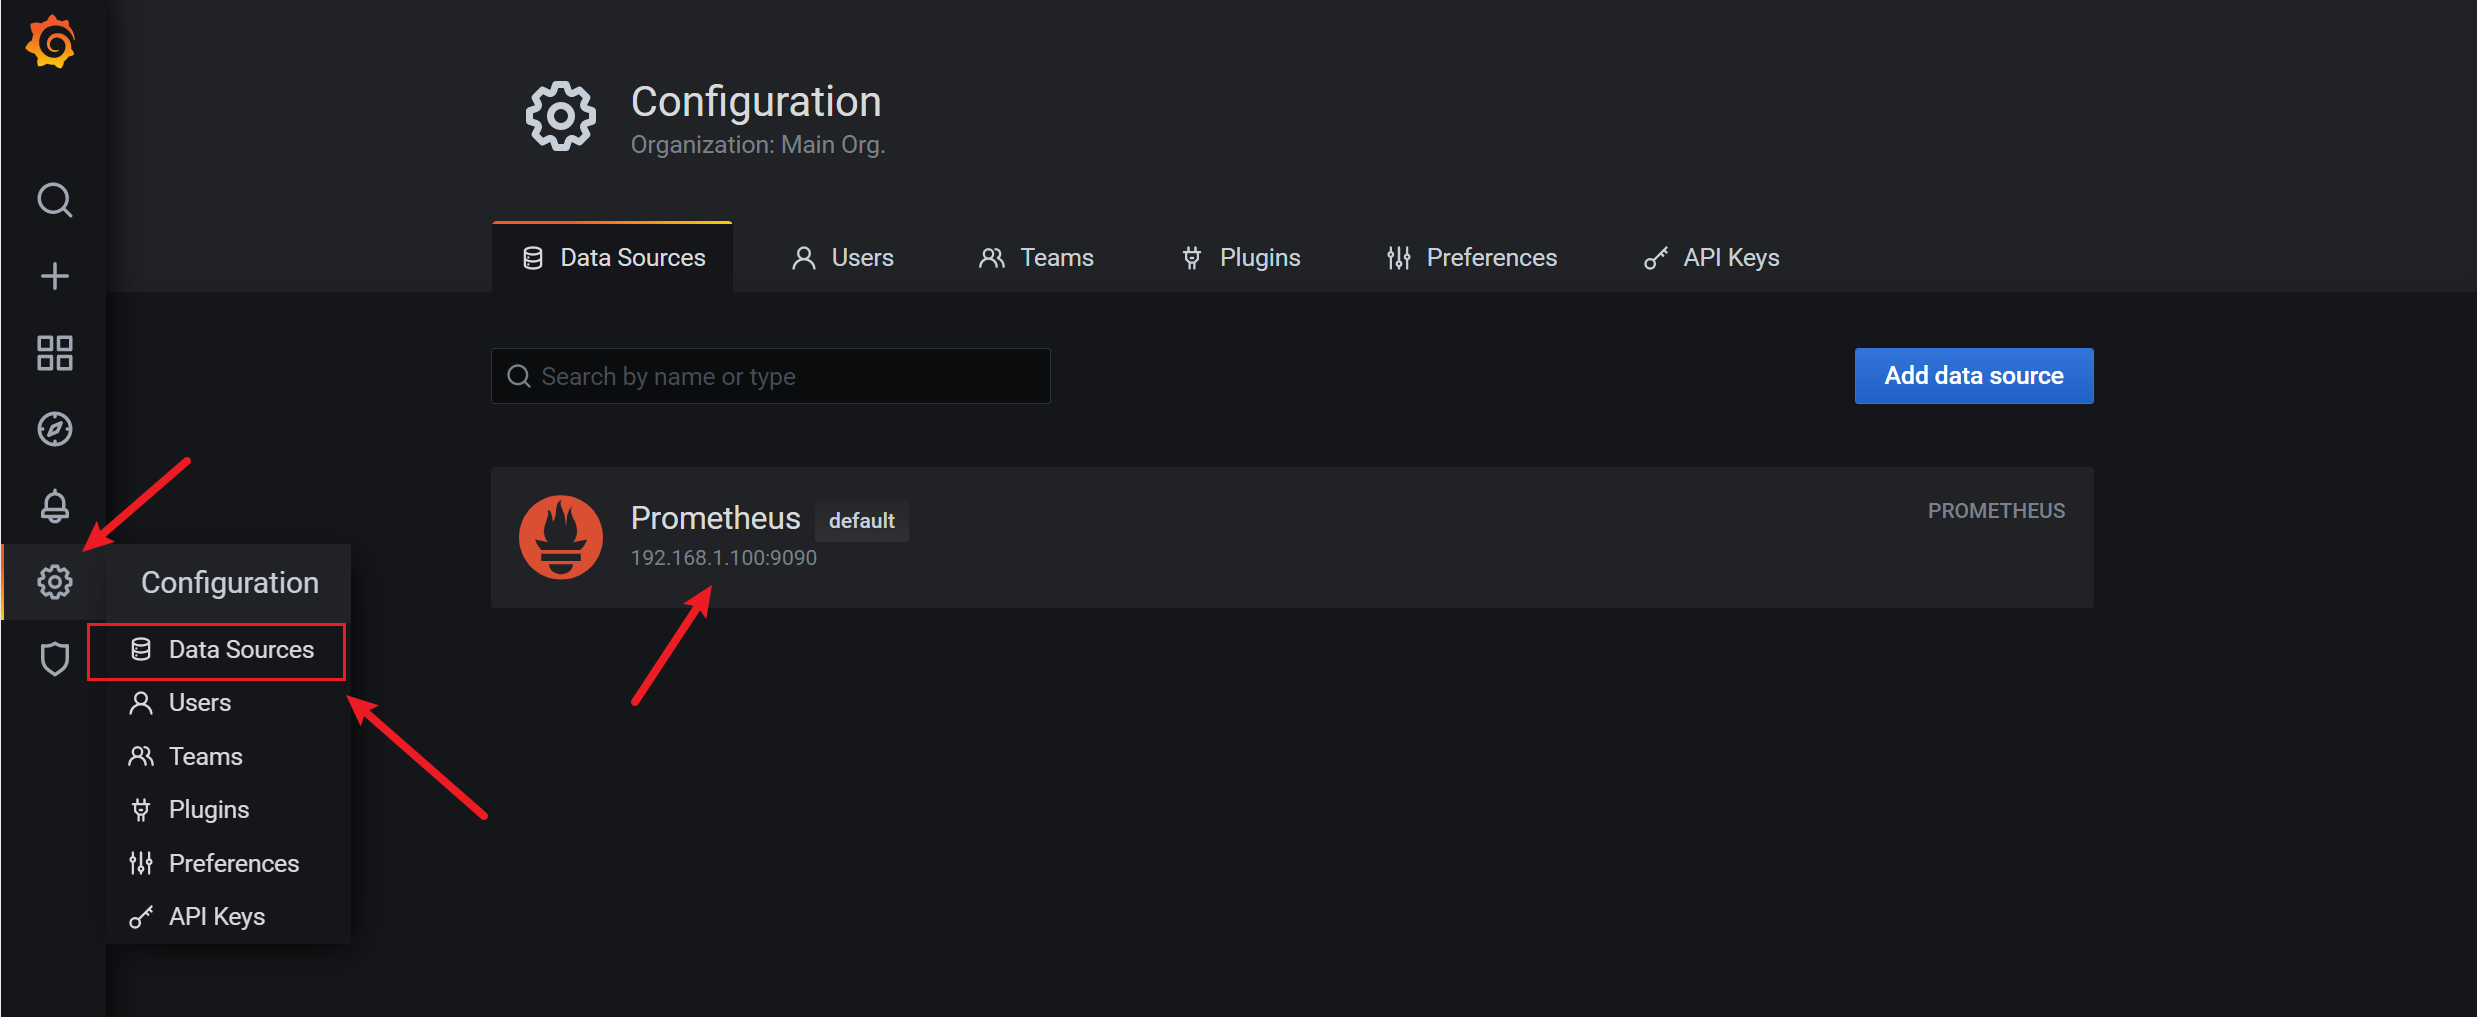
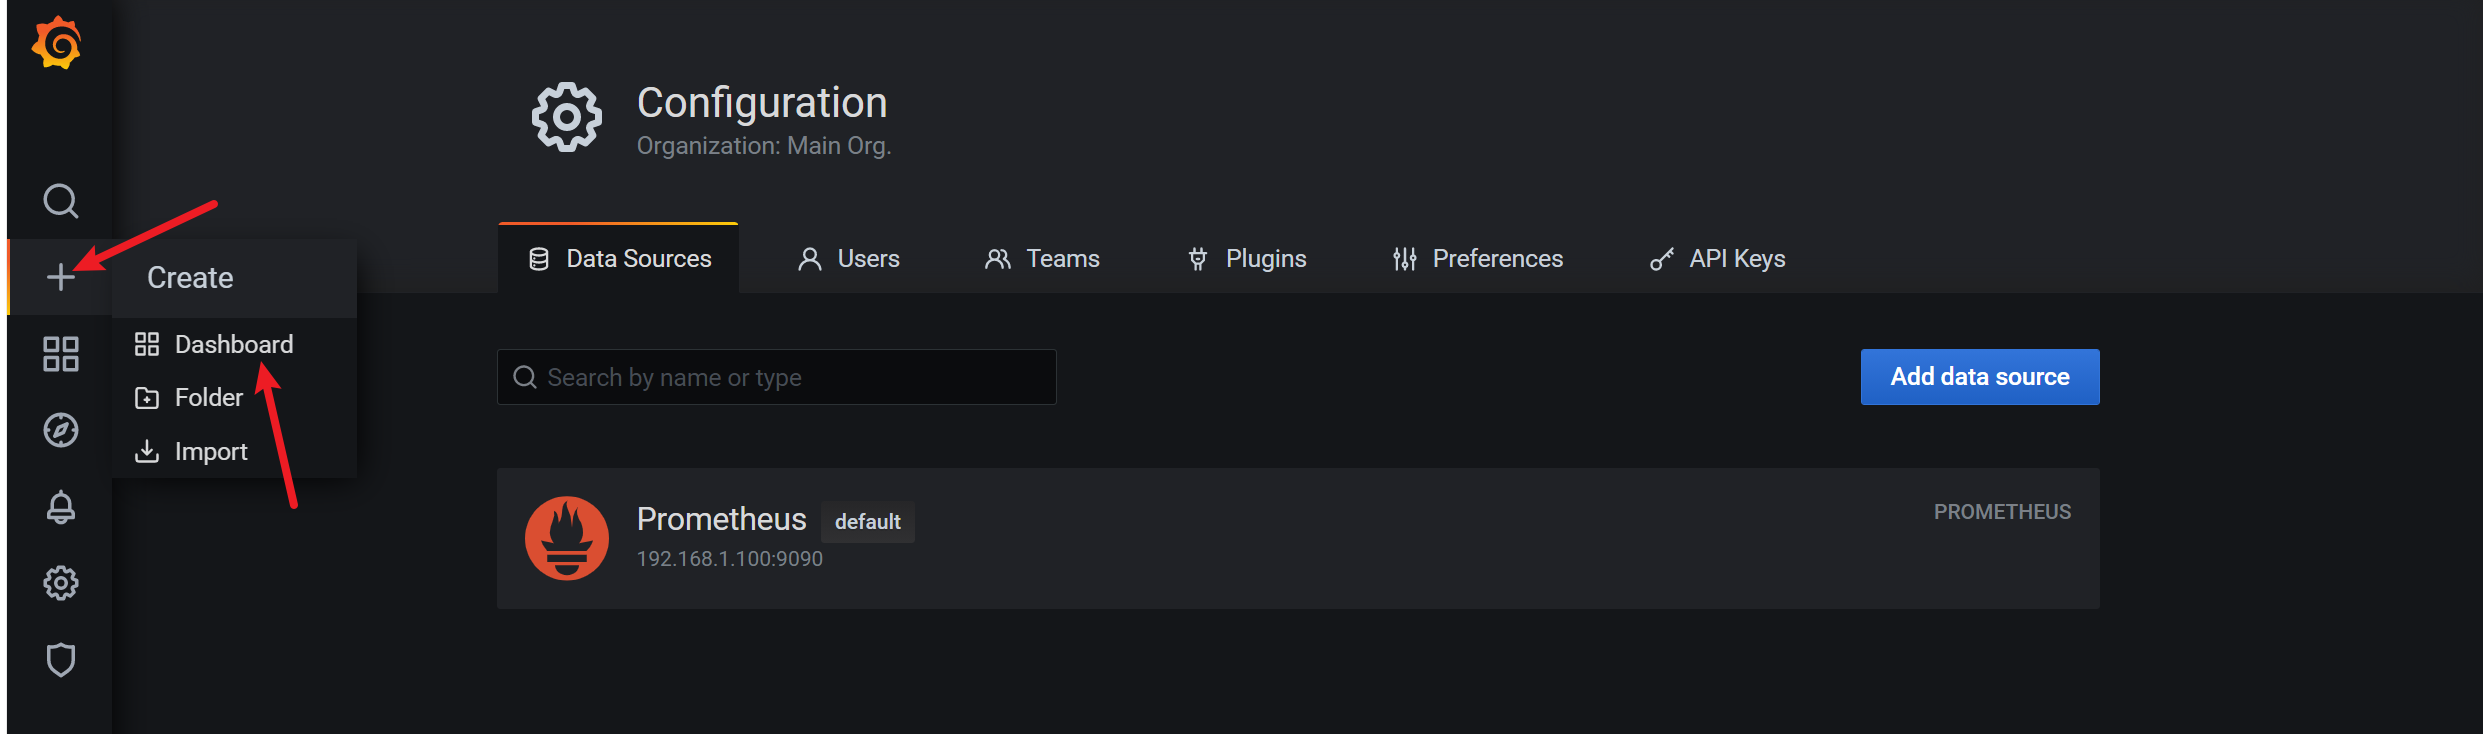
3.7.5 添加数据源
grafana只是一个数据的展示平台,所有的数据都需要外部的,因此需要添加一个数据源
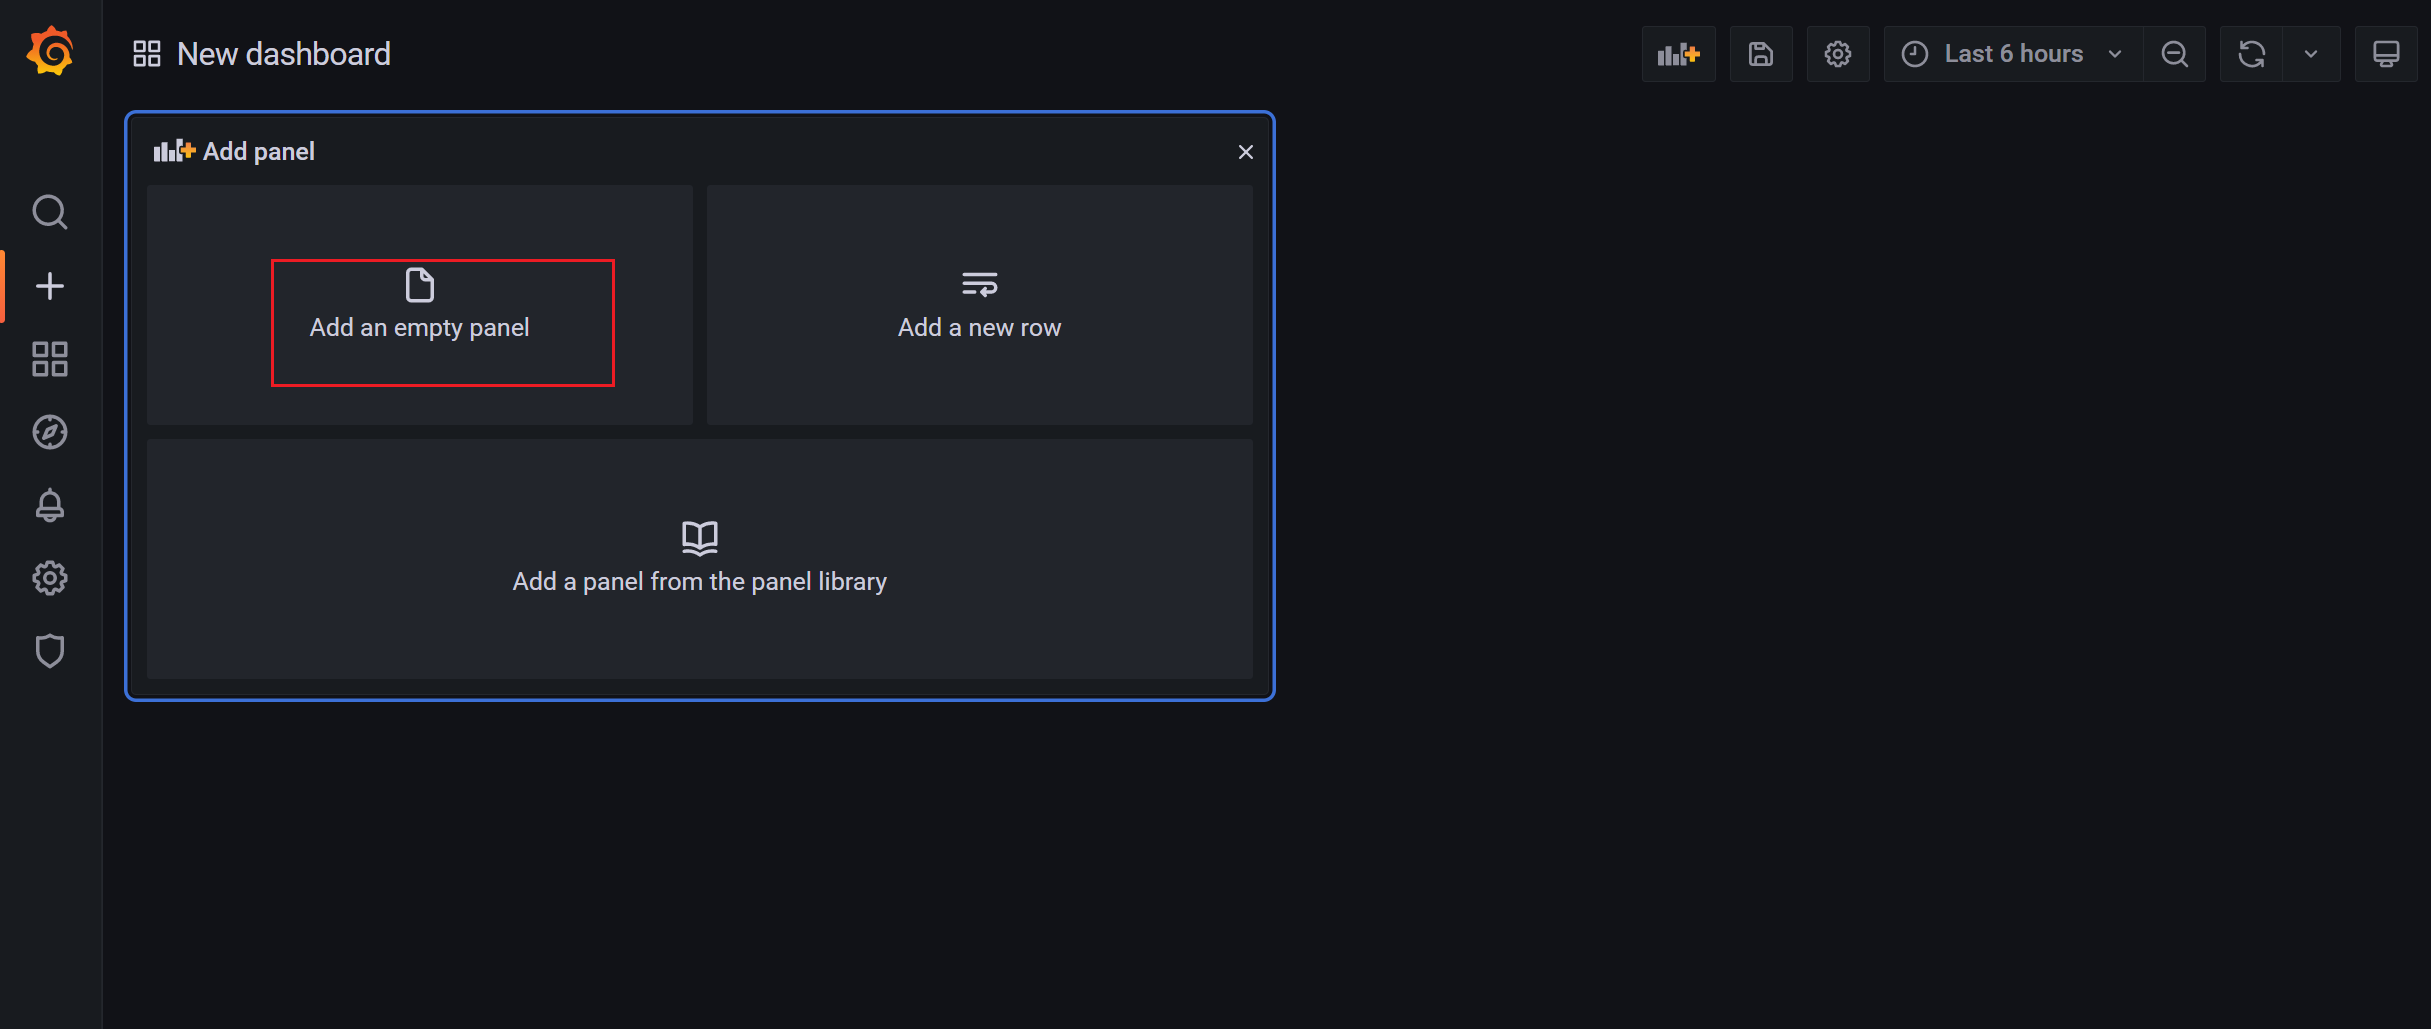
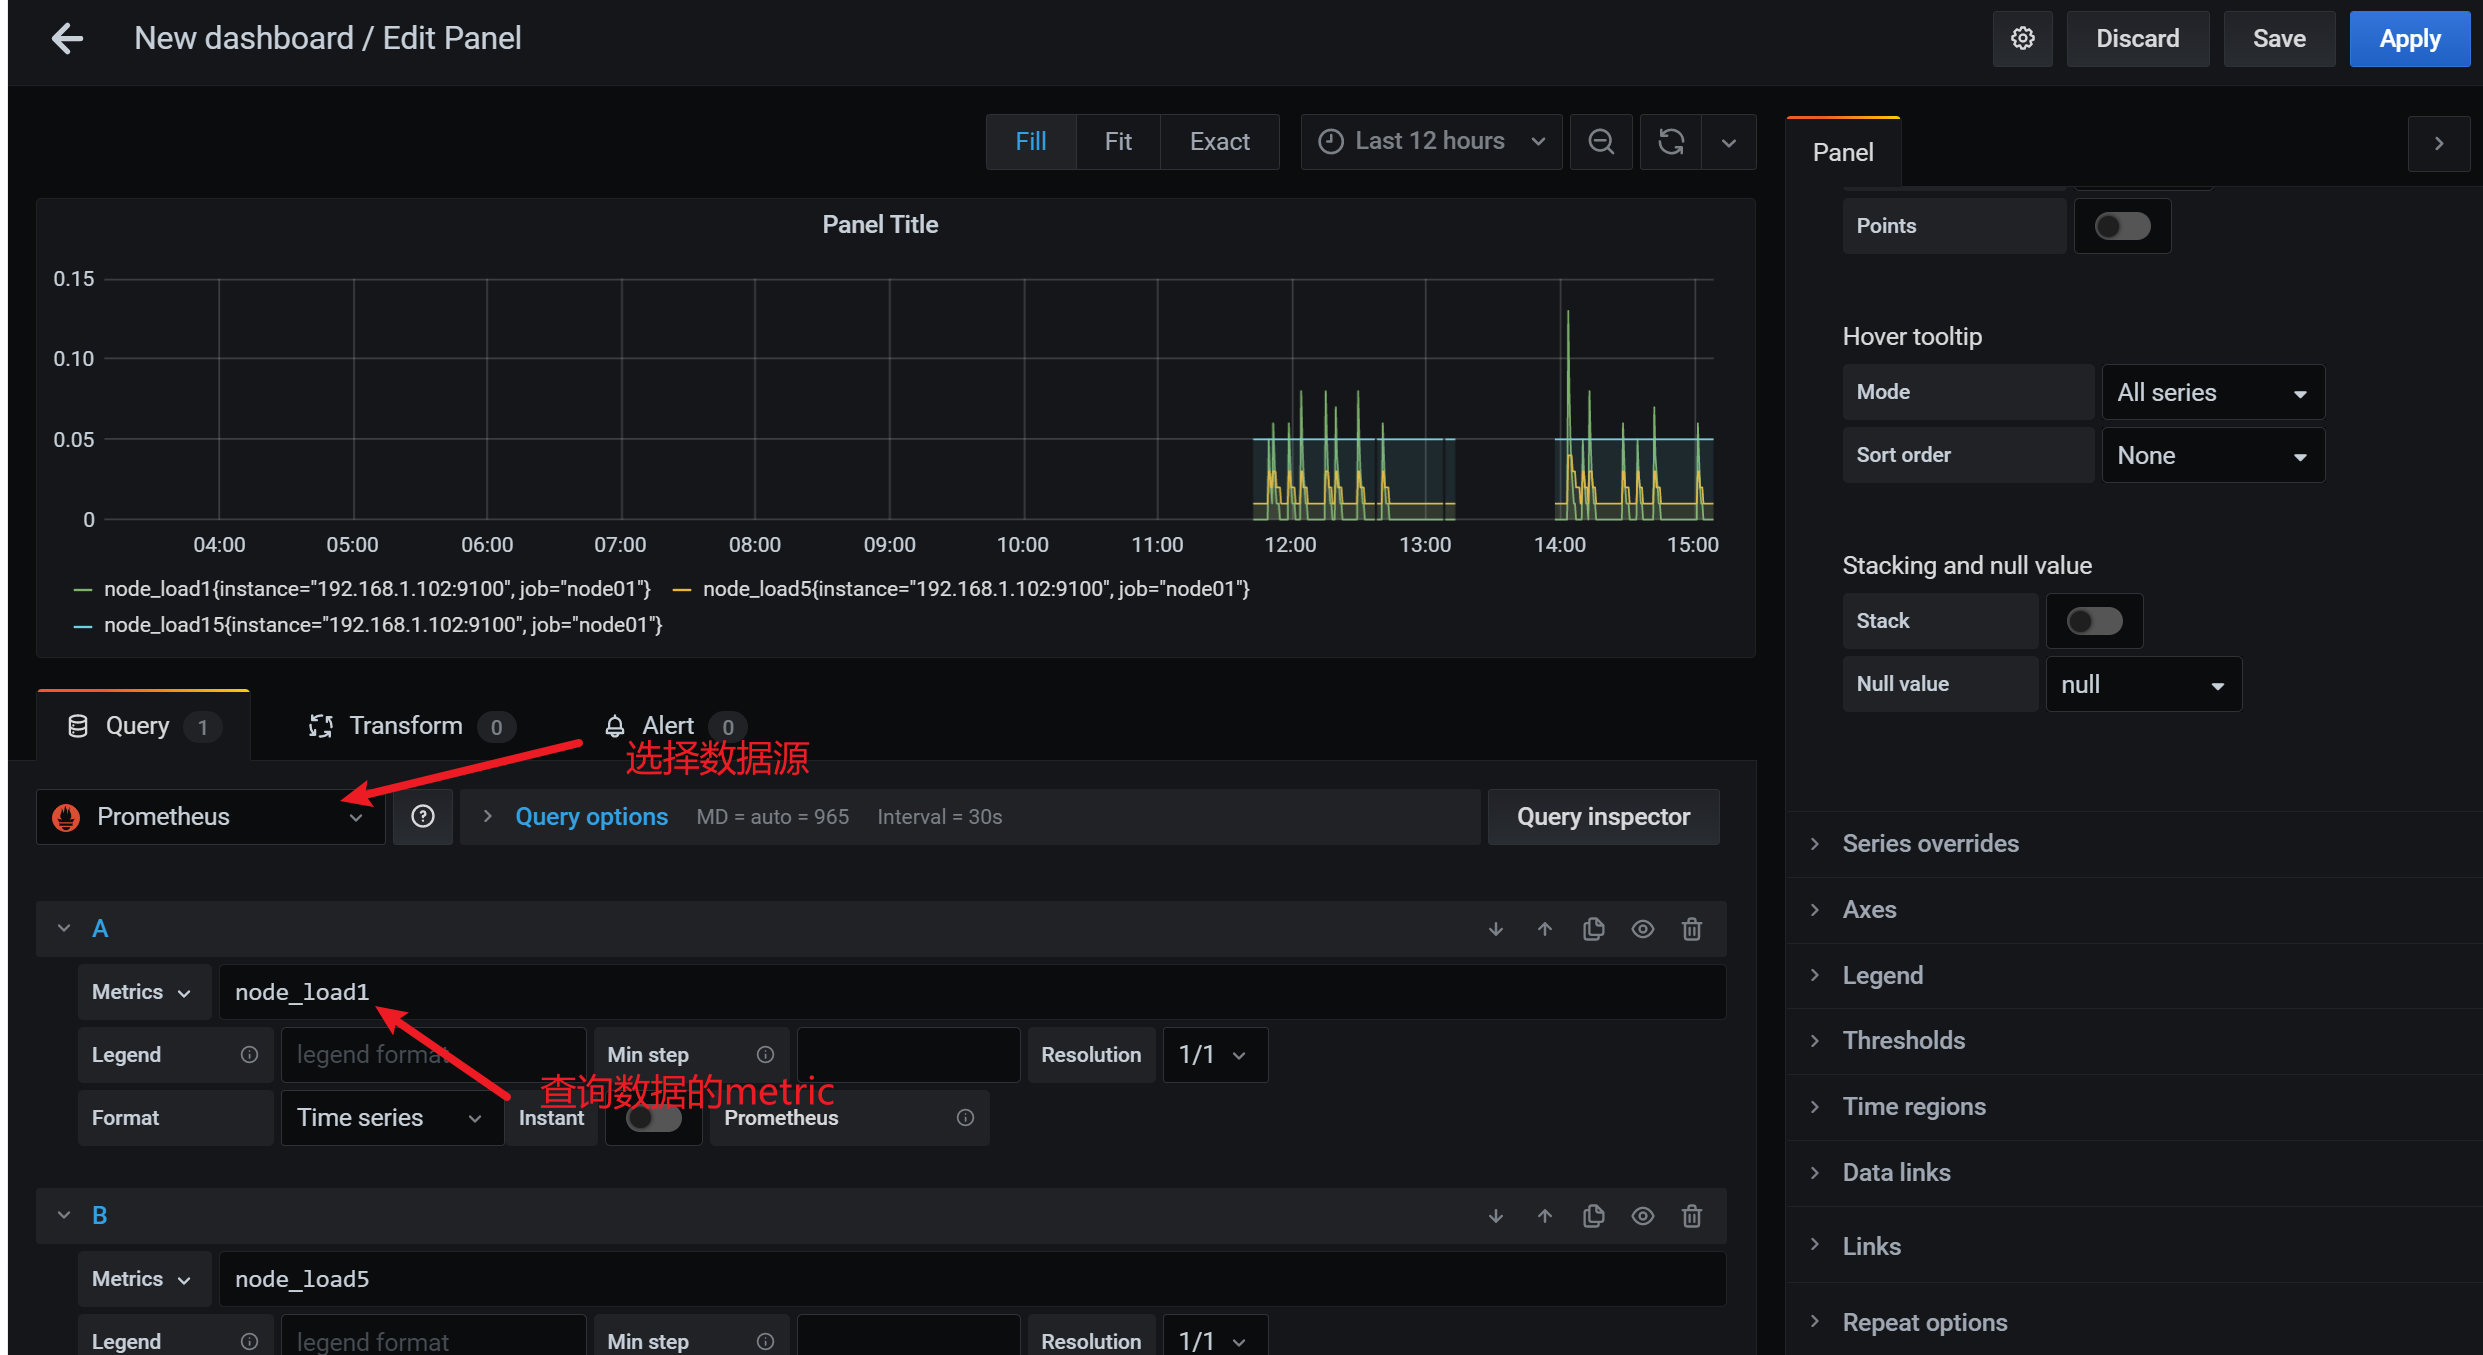
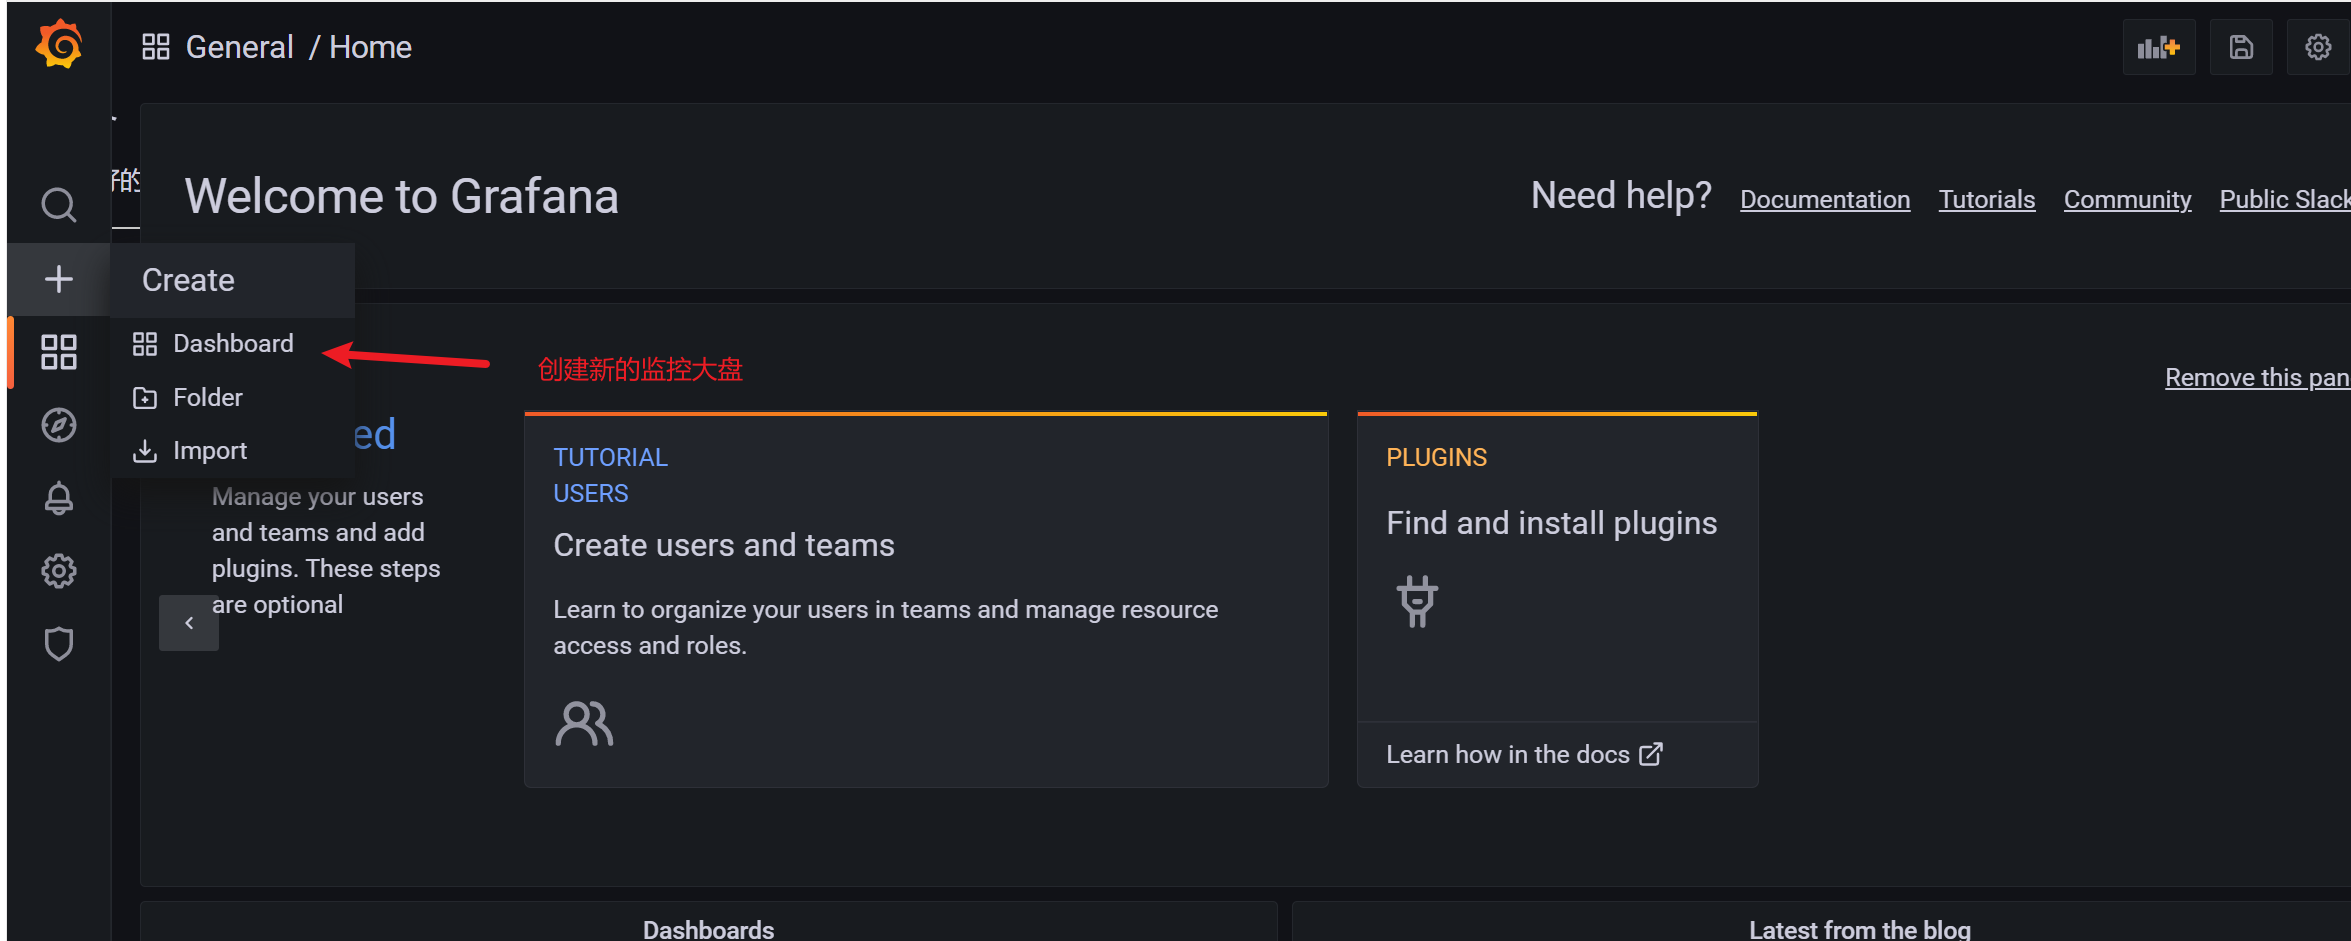
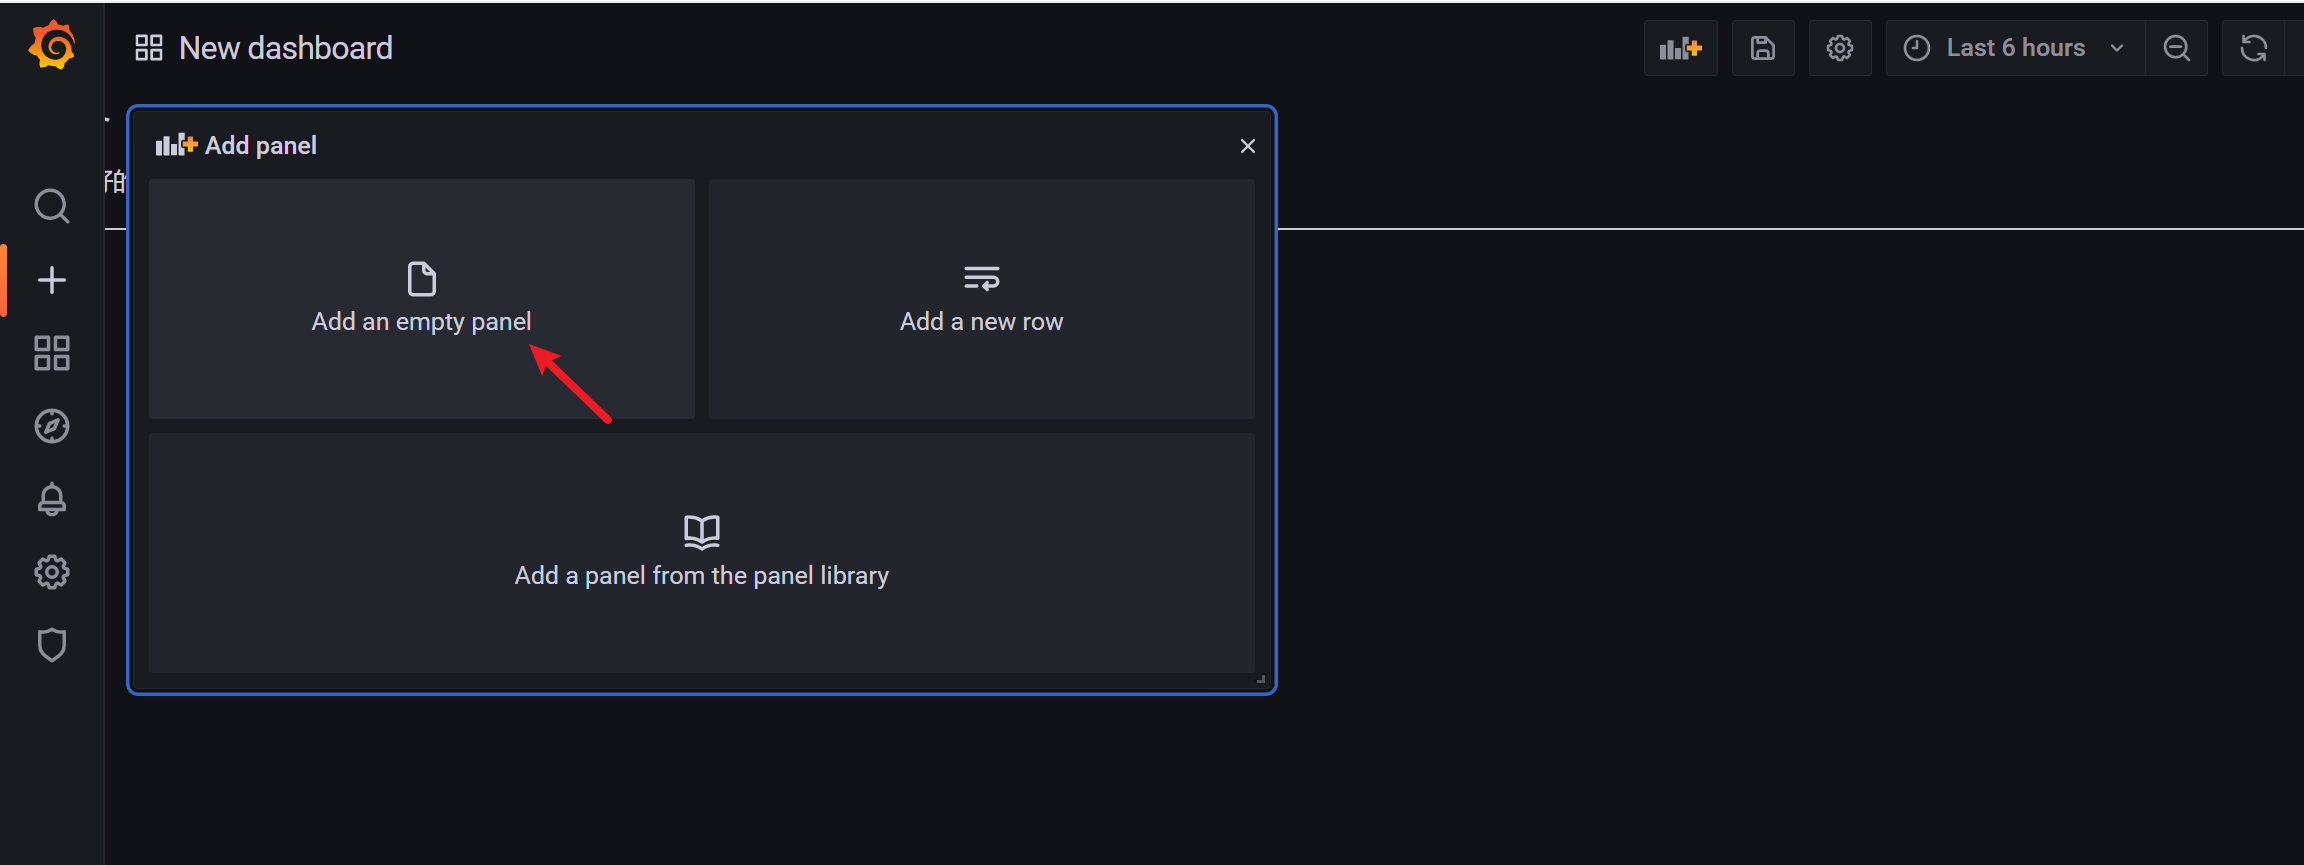
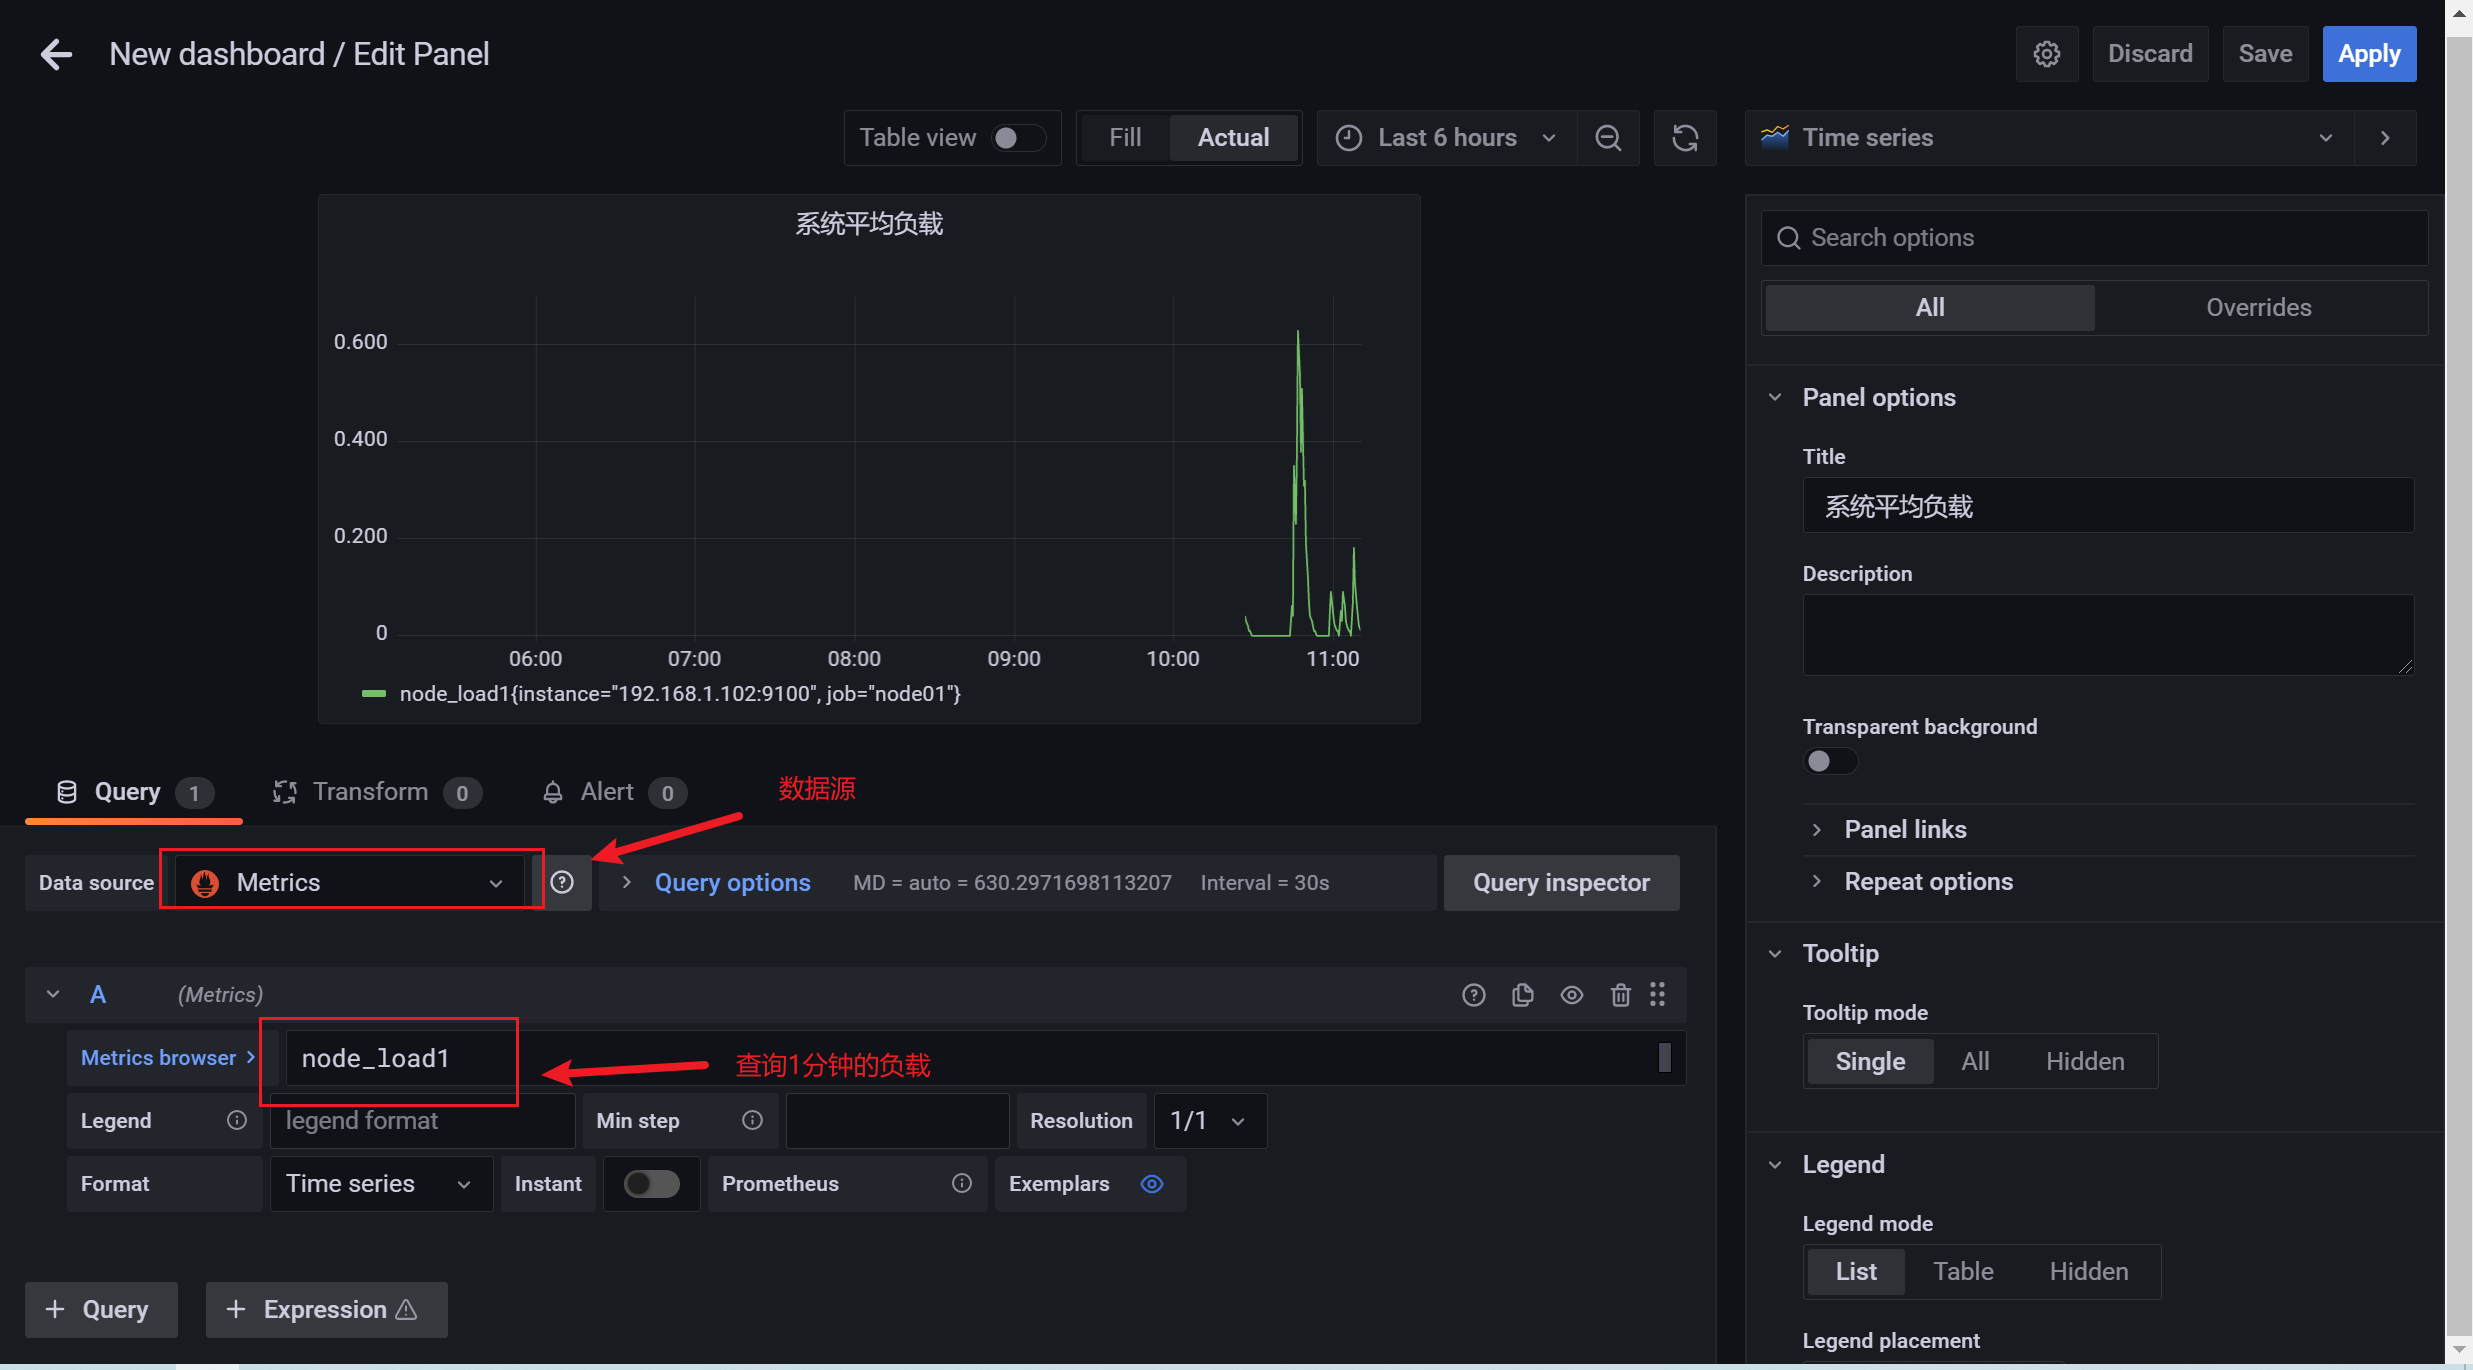
3.7.6 添加grafana的面板
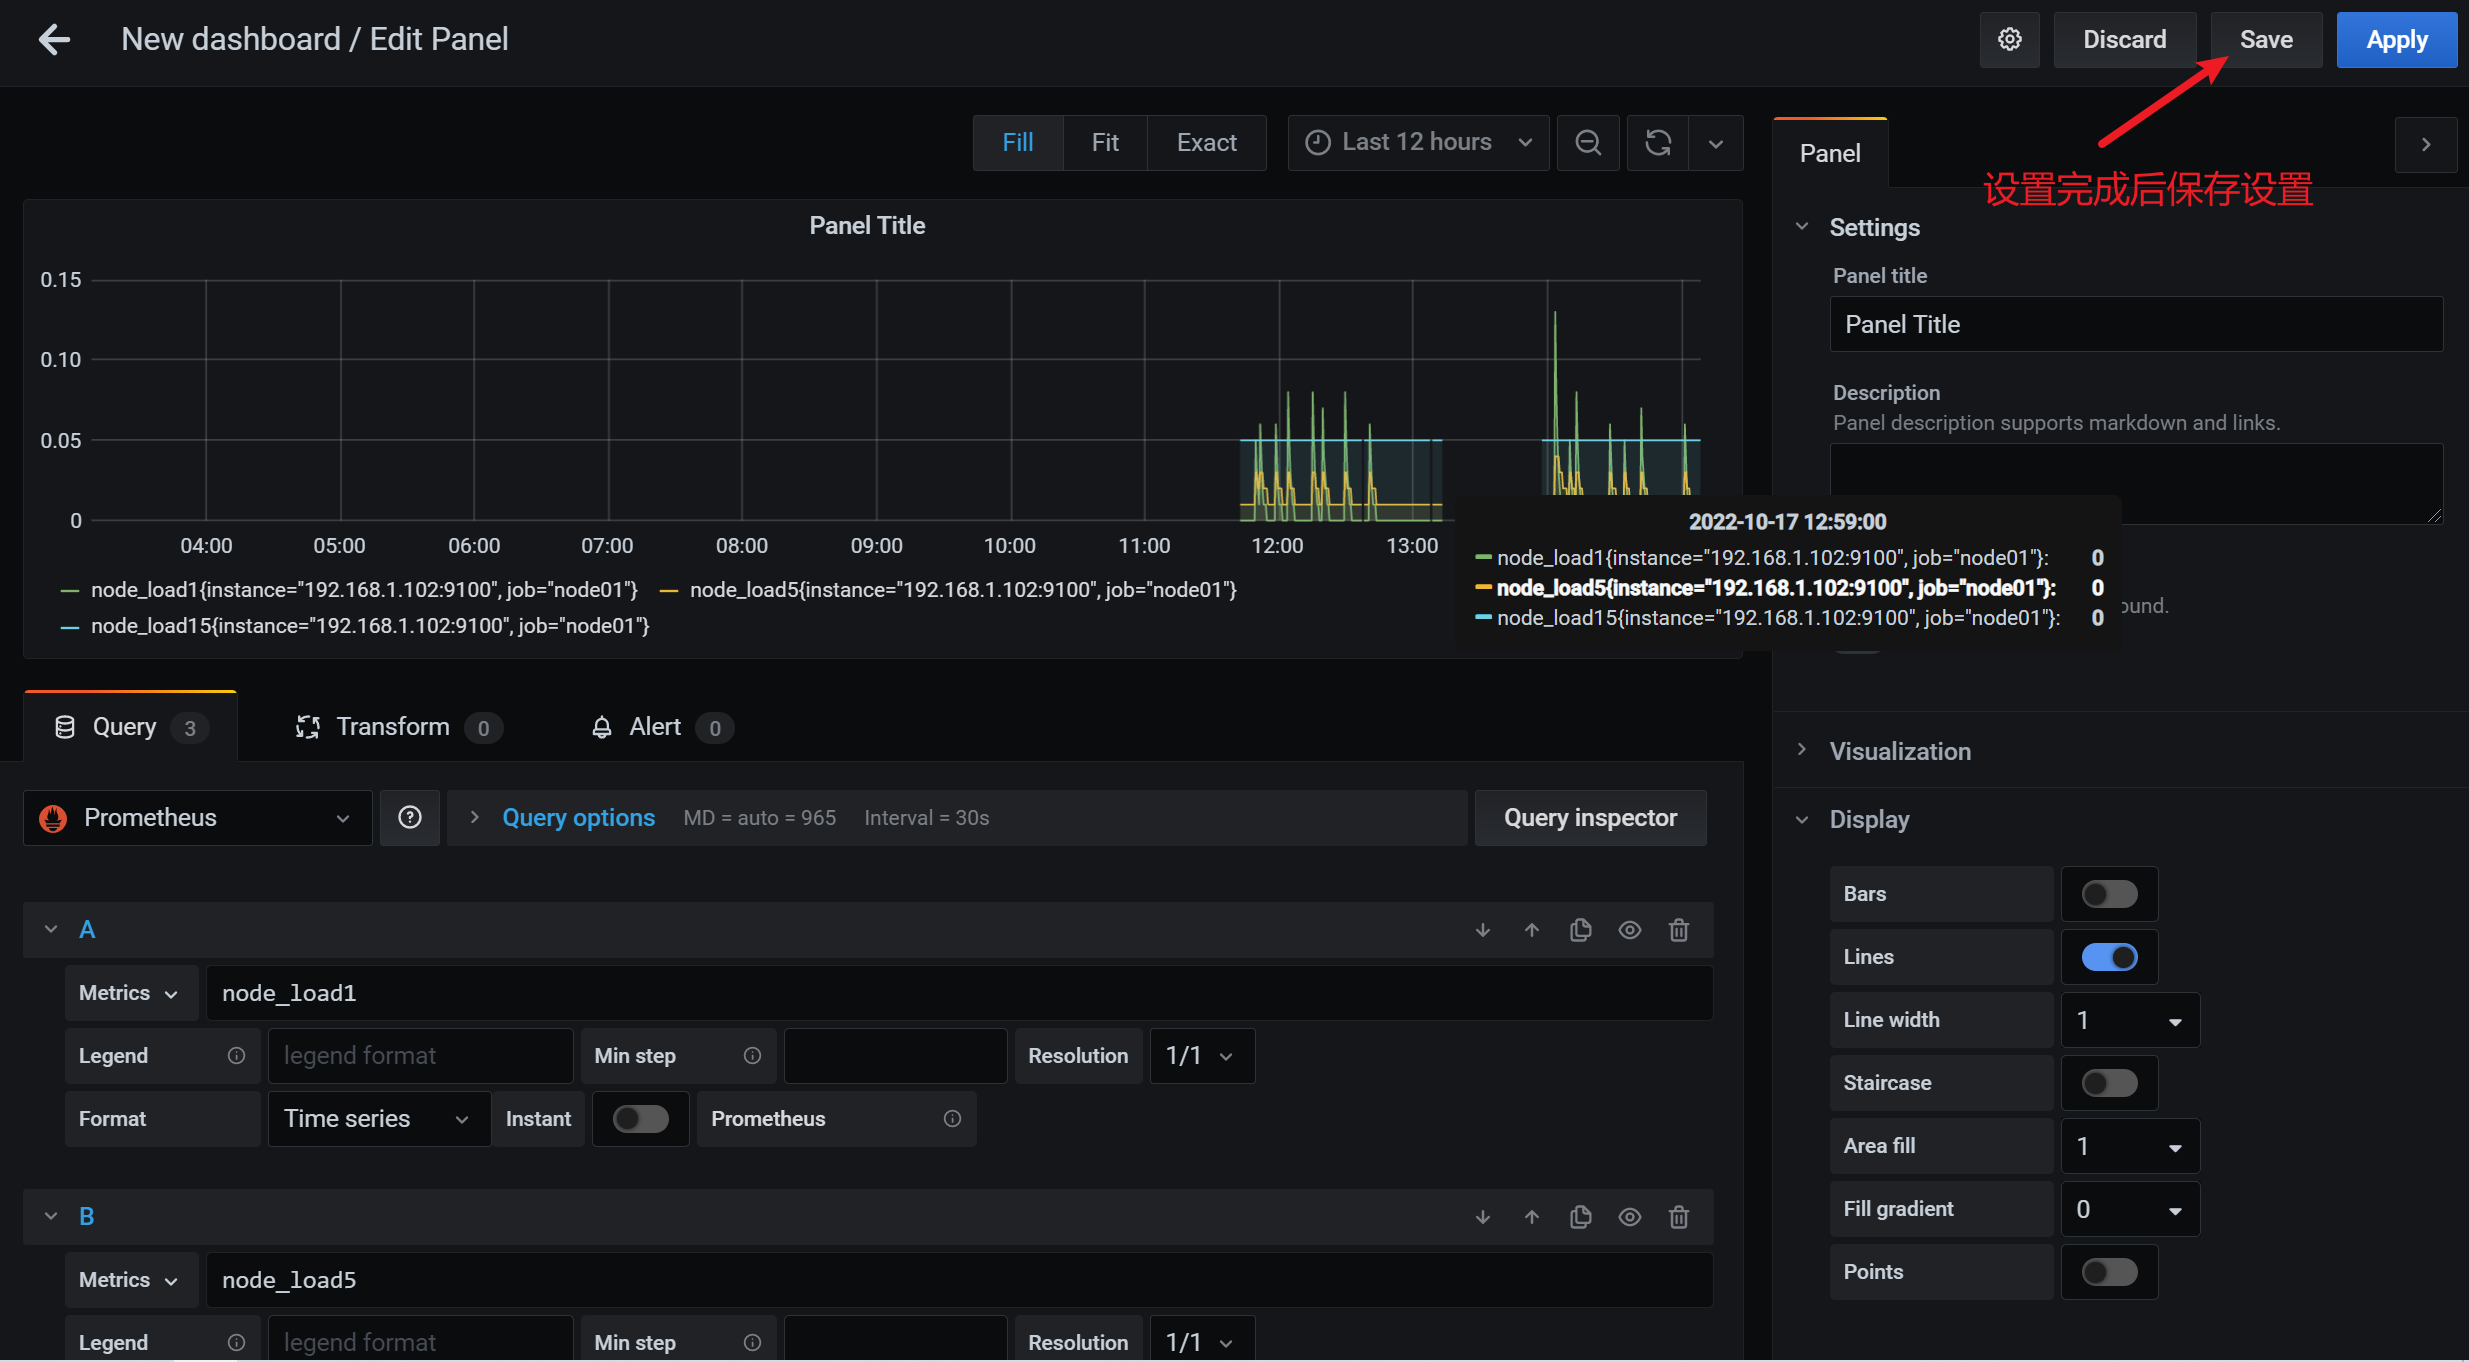
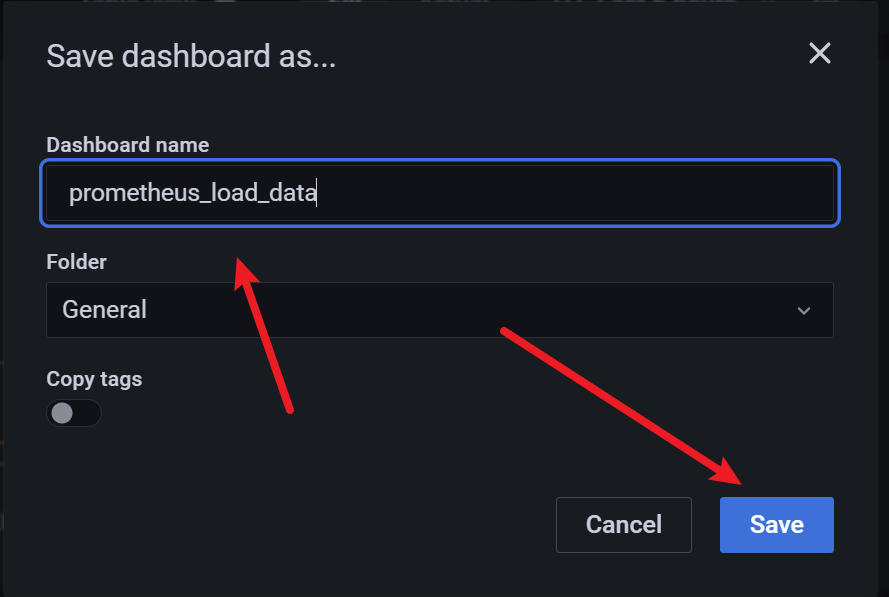
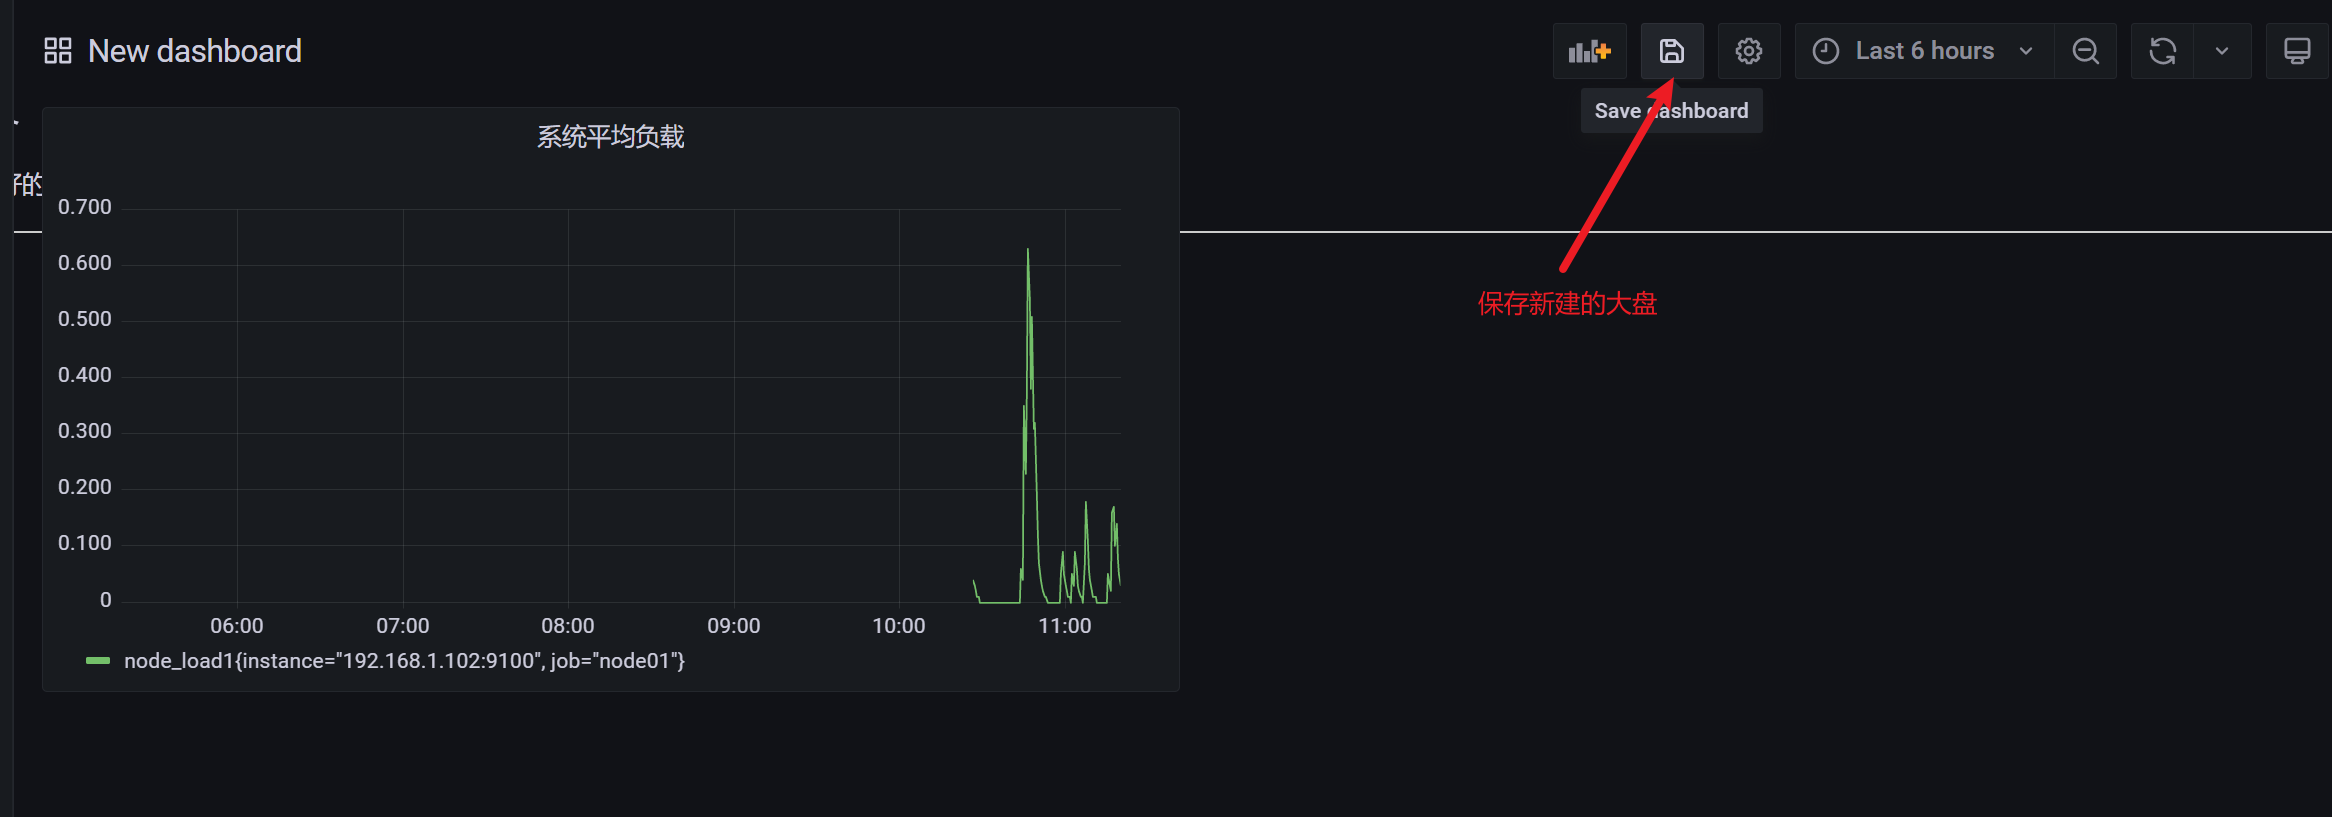
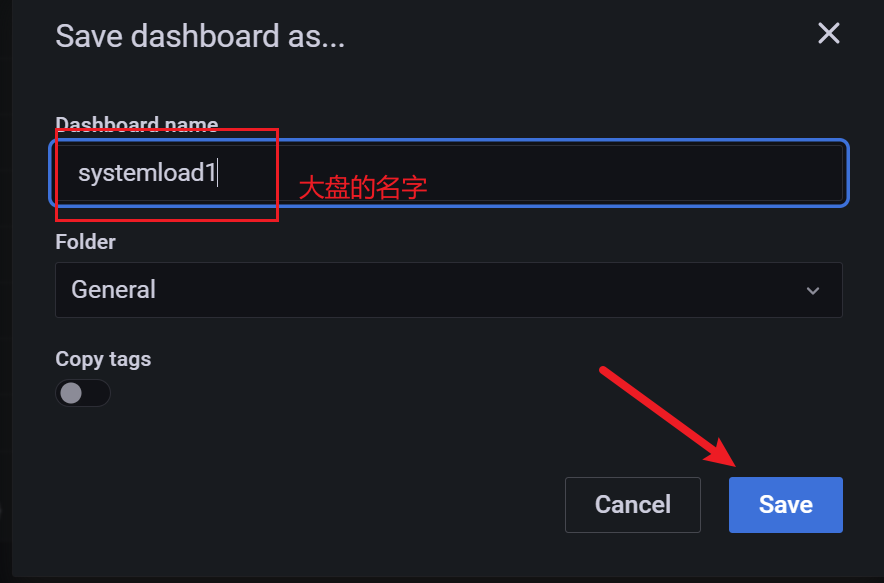
3.7.7 保存面板设置
3.8 grafana图形显示mariadb监控数据
根据上面的思路,我们可以将mysql_global_status_threads_connected这个metrics加到dashboard实现对mysq数据库的当前连接数的监控。但是mysql需要监控的状态非常的多(mysql> show status :得到的状态信息几乎都可以监控),动添加太累了。有没有类似zabbix里的模板那种概念呢?
答案是有的,需要开发人员开发出相应的json格式的模板,然后导入进去就可以了。那么问题来了,谁开发?
有这么几种途径:
•如果公司有这方面的专业开发支持,就可以实现定制化的监控,运维工程师配合就好
•当然运维工程师也可以学习并实现这方面的开发
•寻找别人开发好的开源

项目grafana-dashboards就是这样的开源项目
参考网址:https://github.com/percona/grafana-dashboards
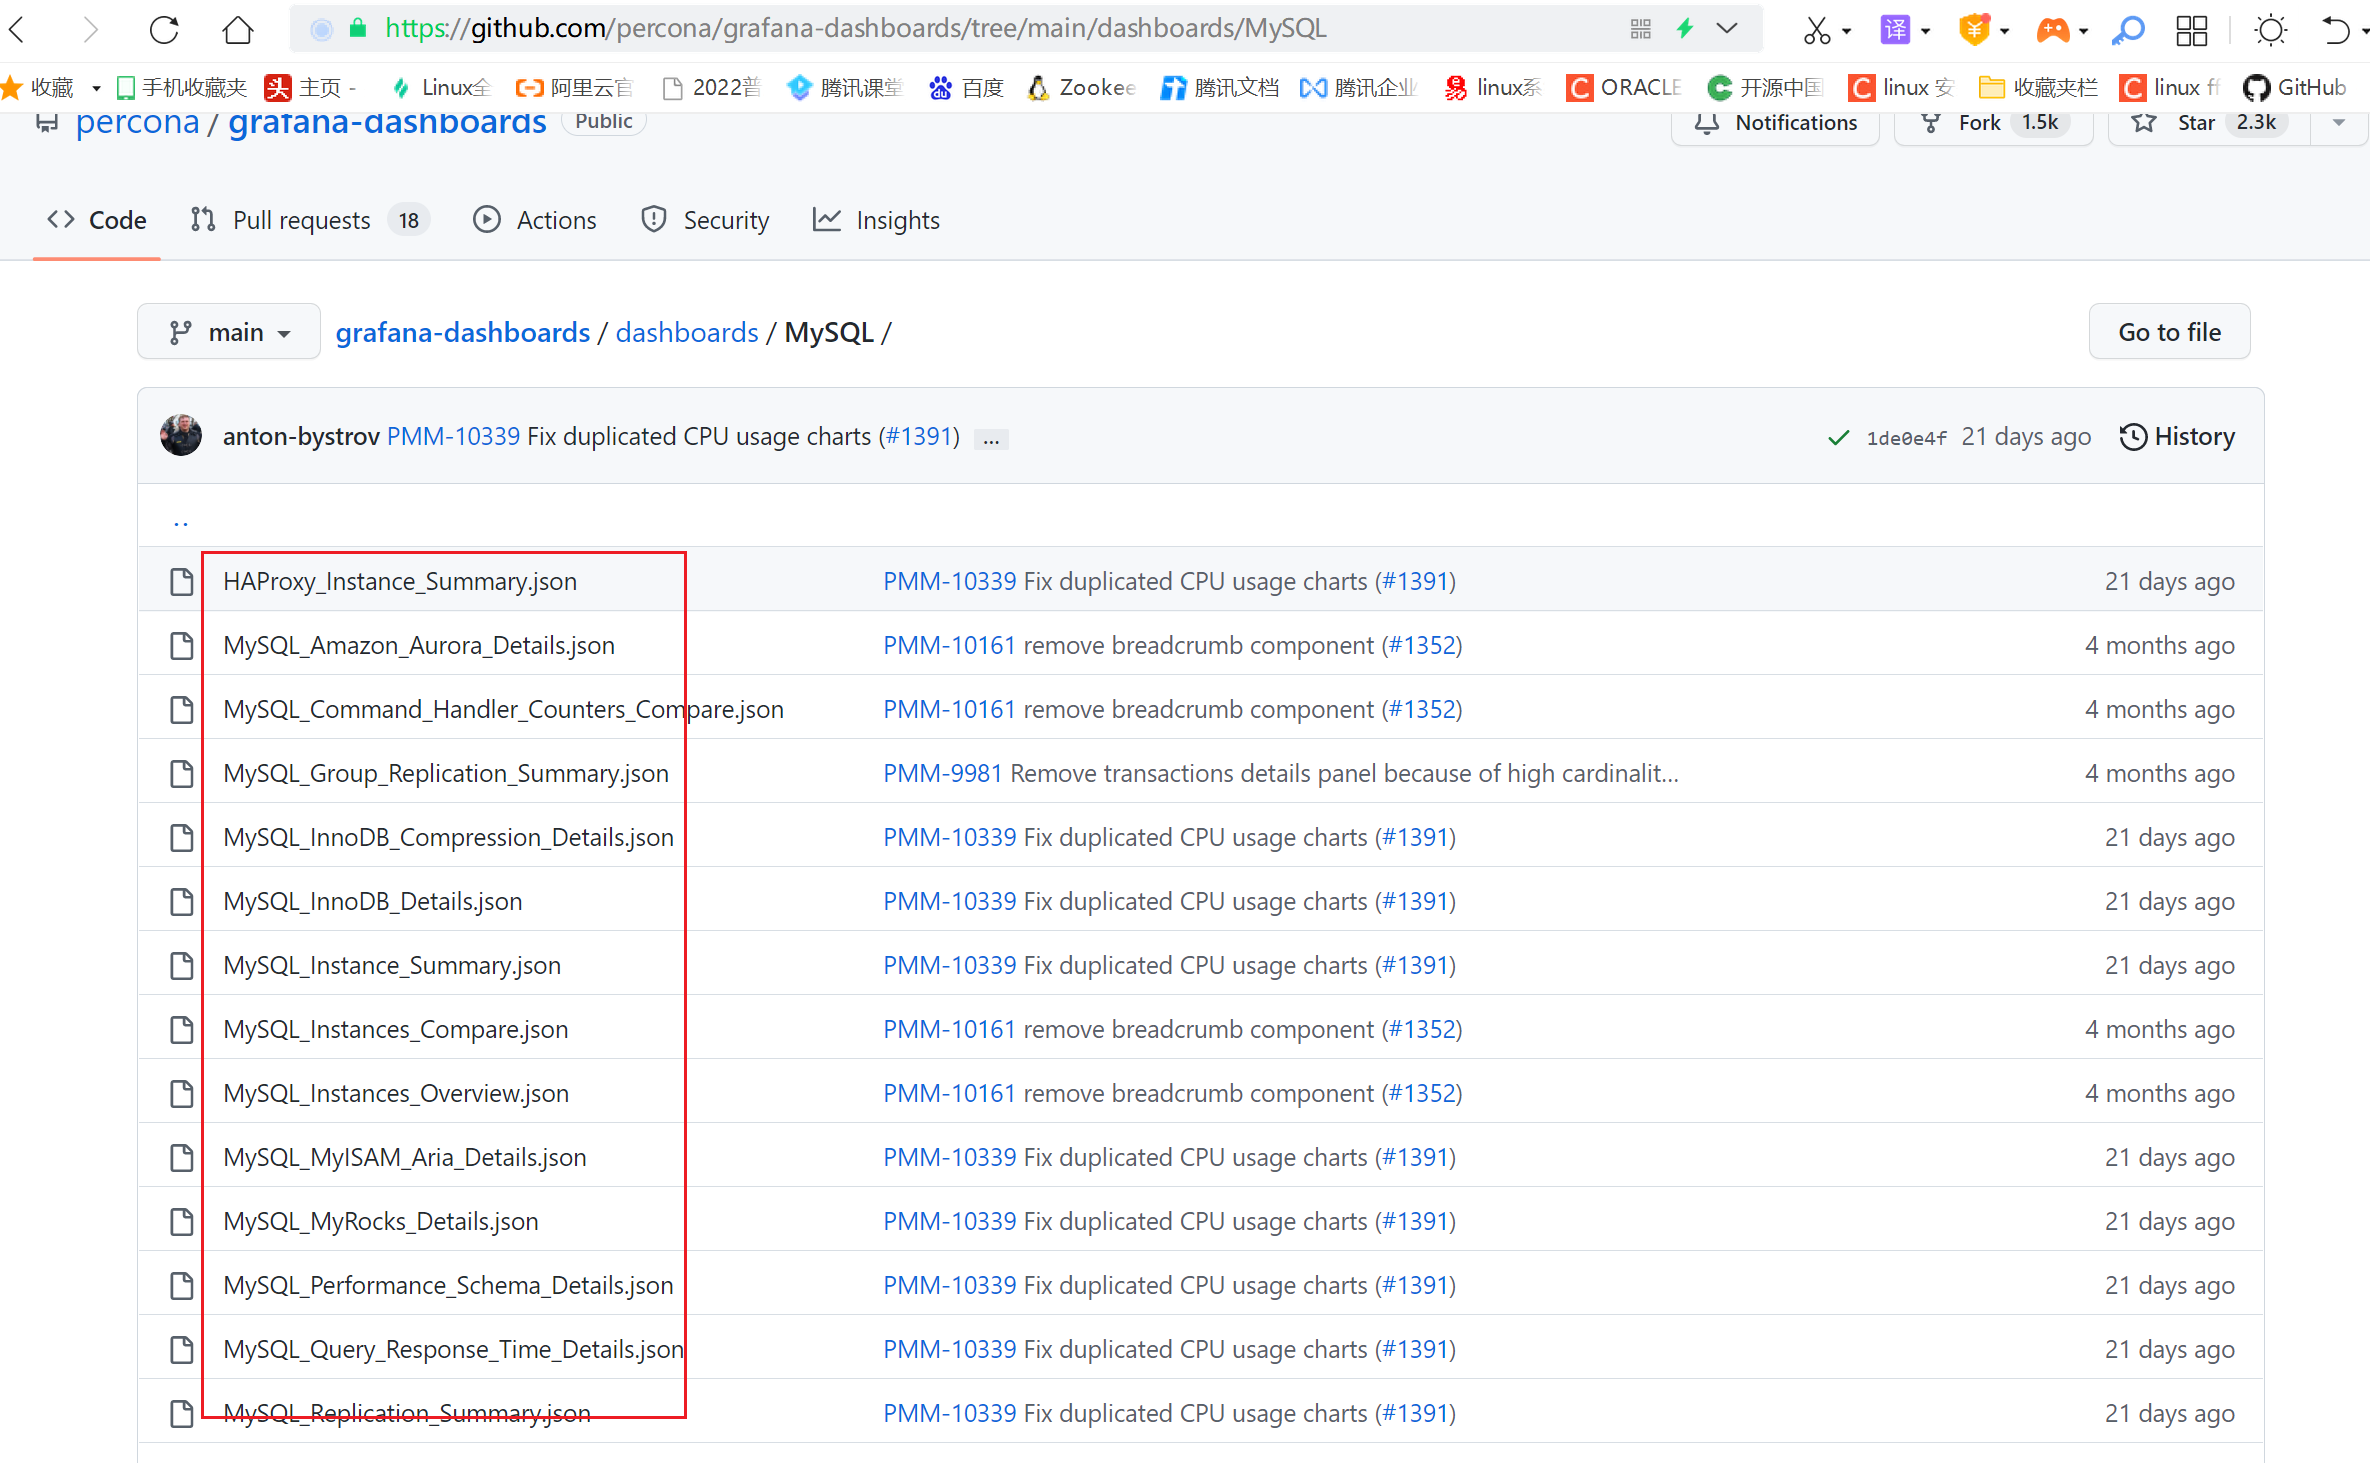
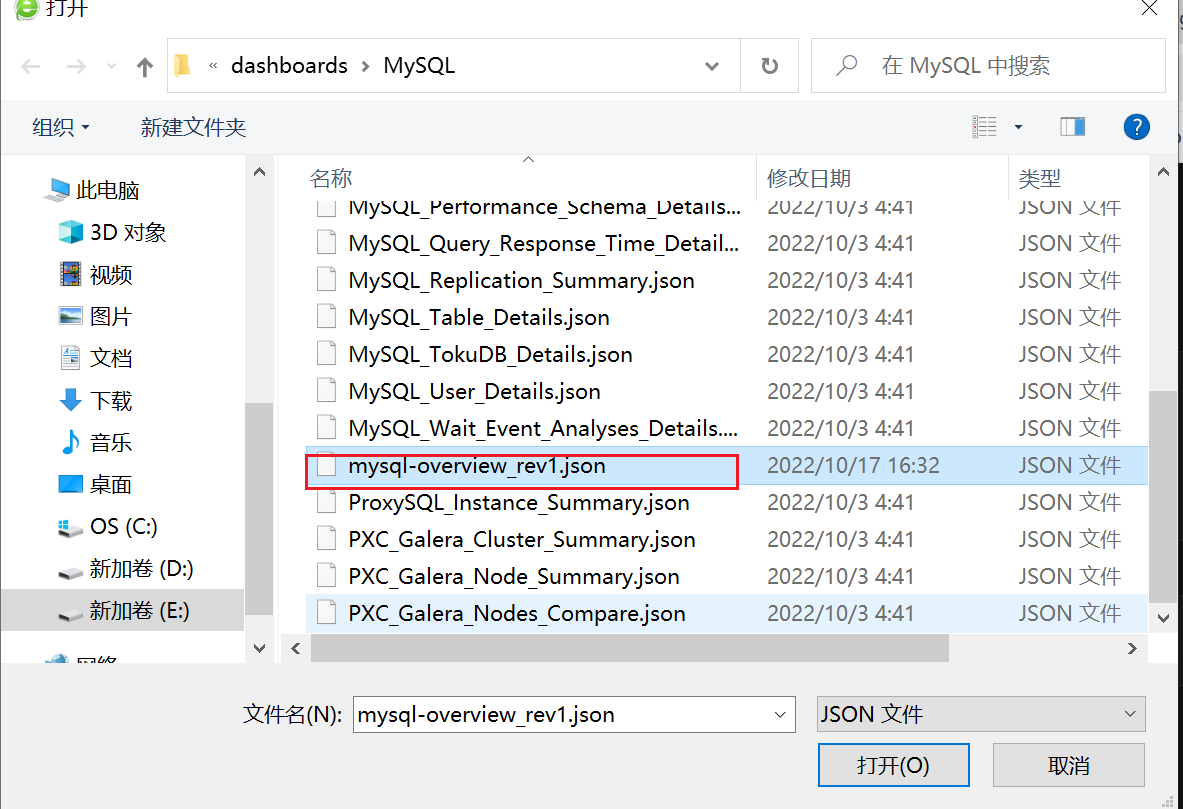
由于github下载速度非常慢,我这里已经提前将所有的json文件下载到本地了
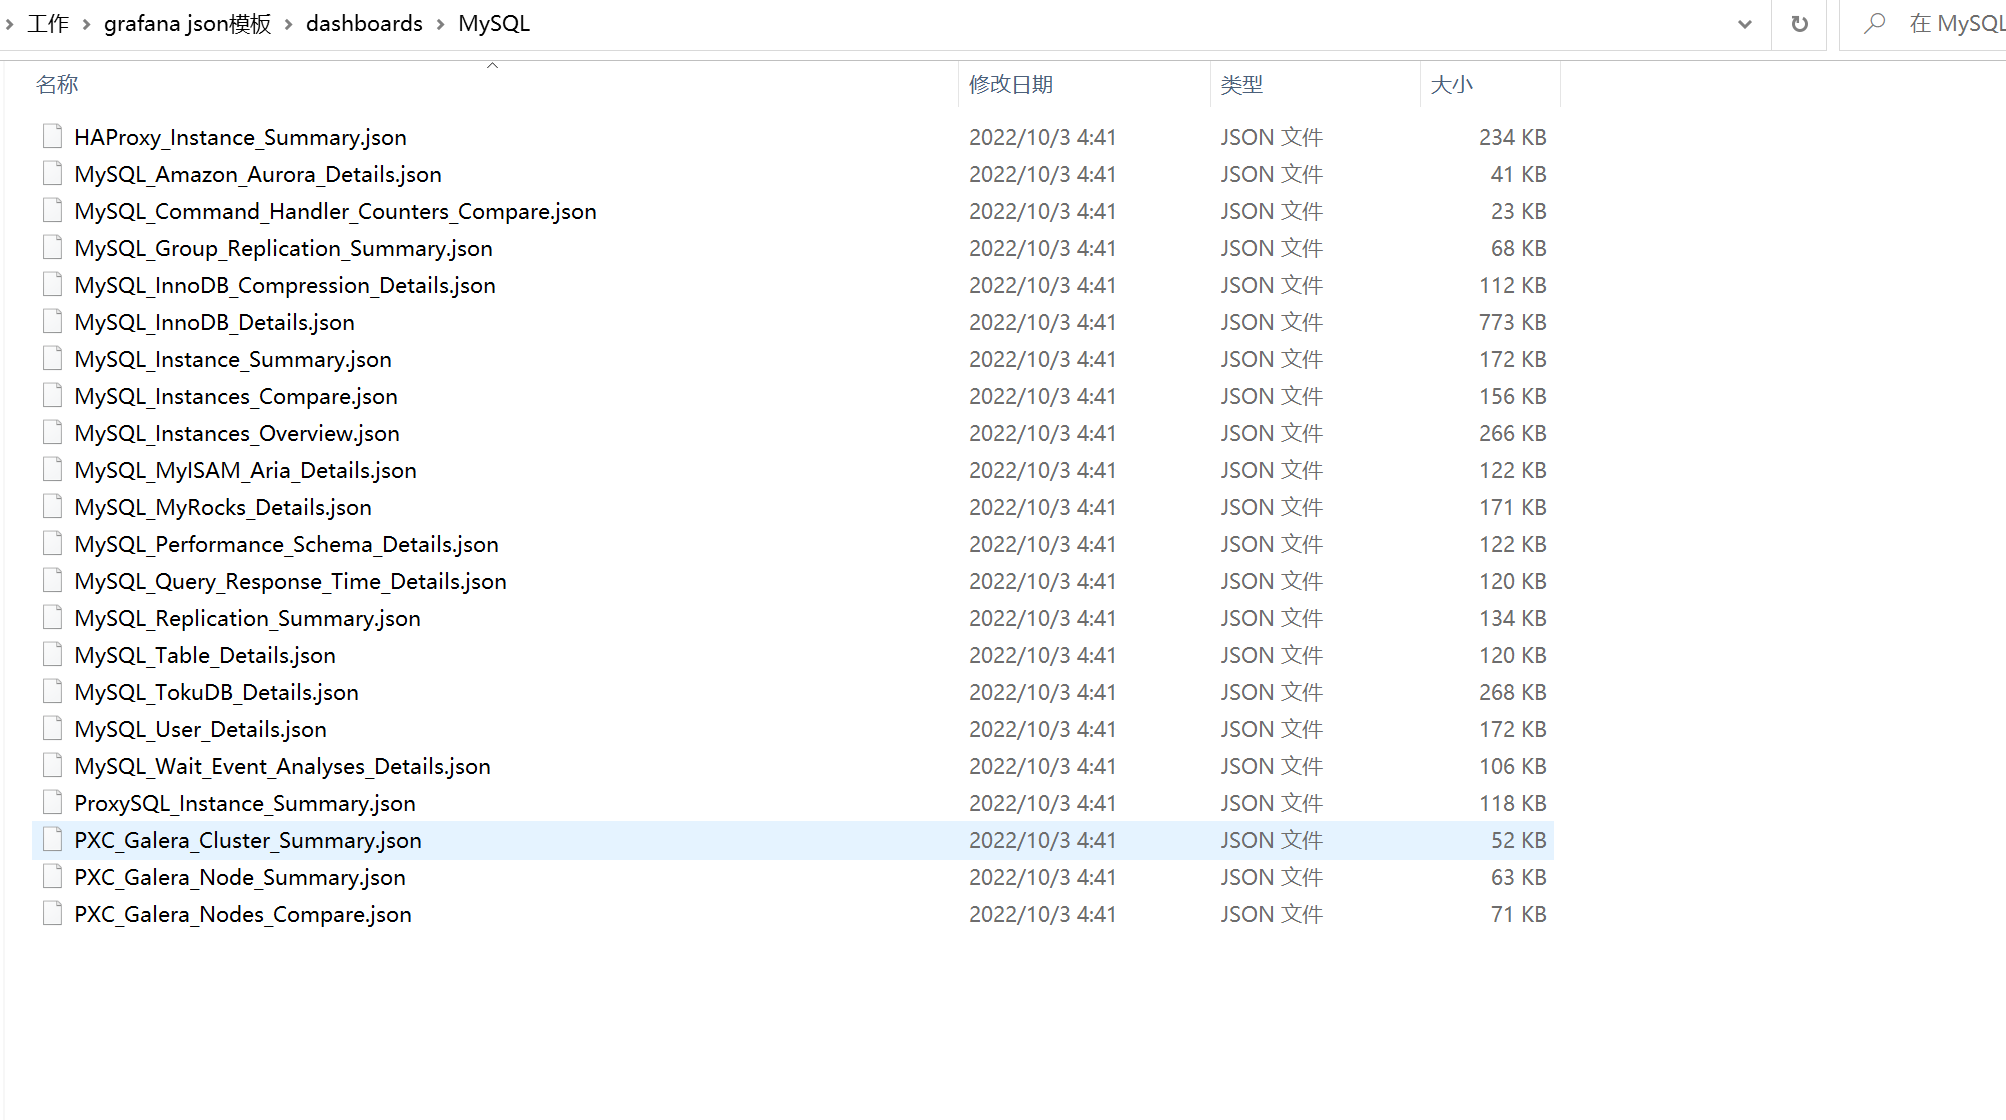
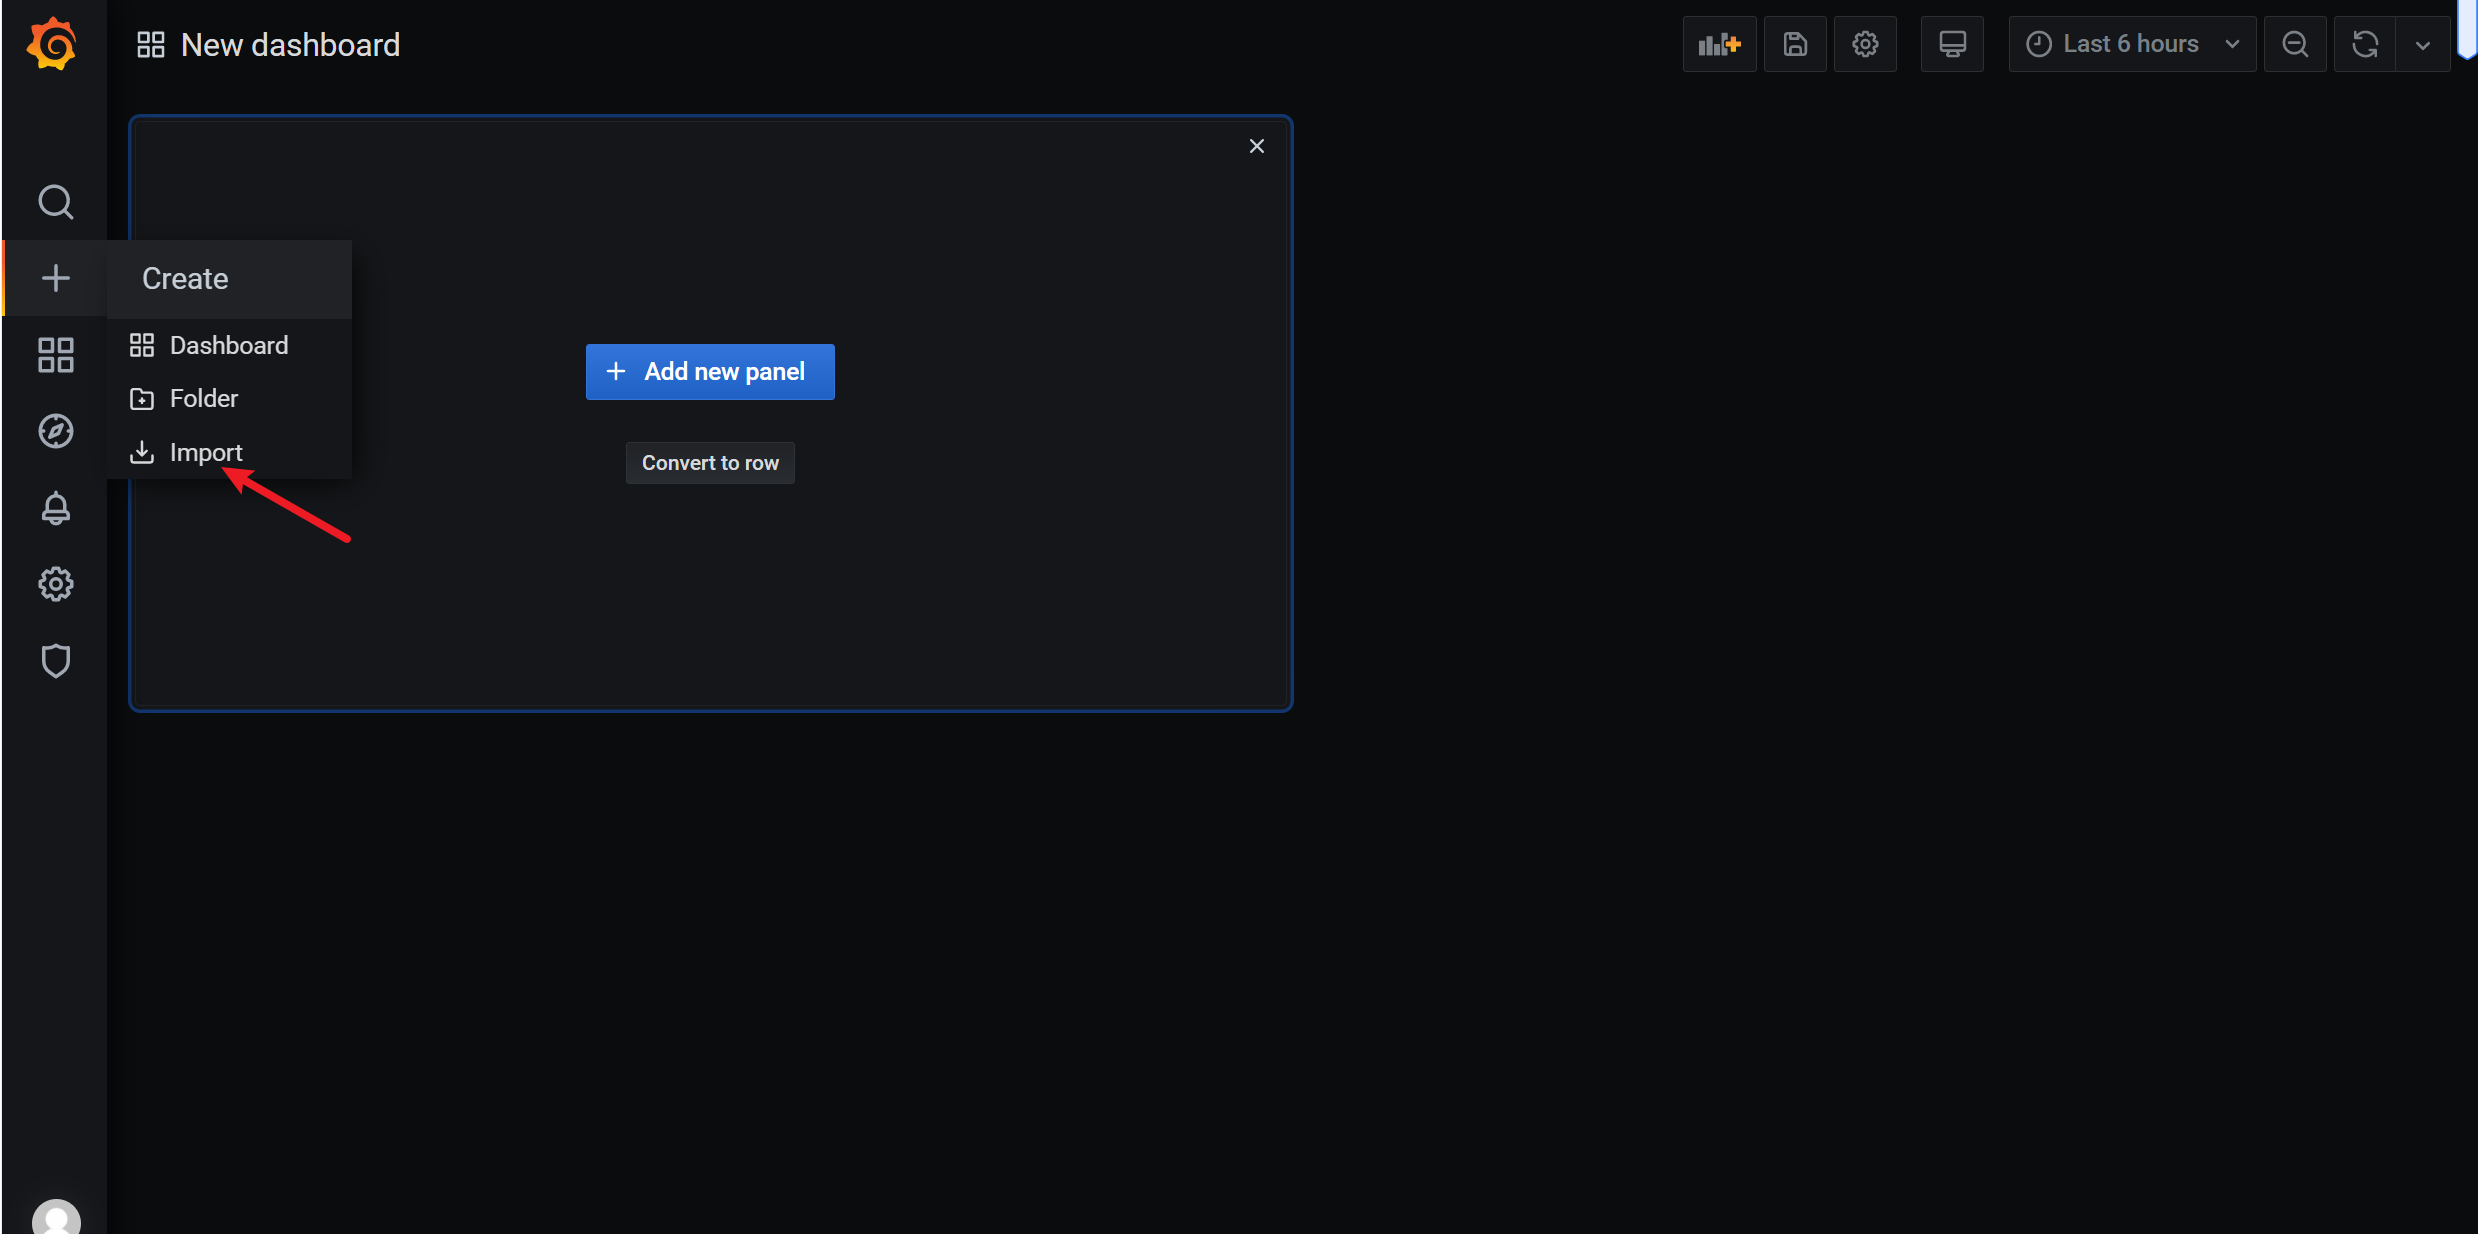
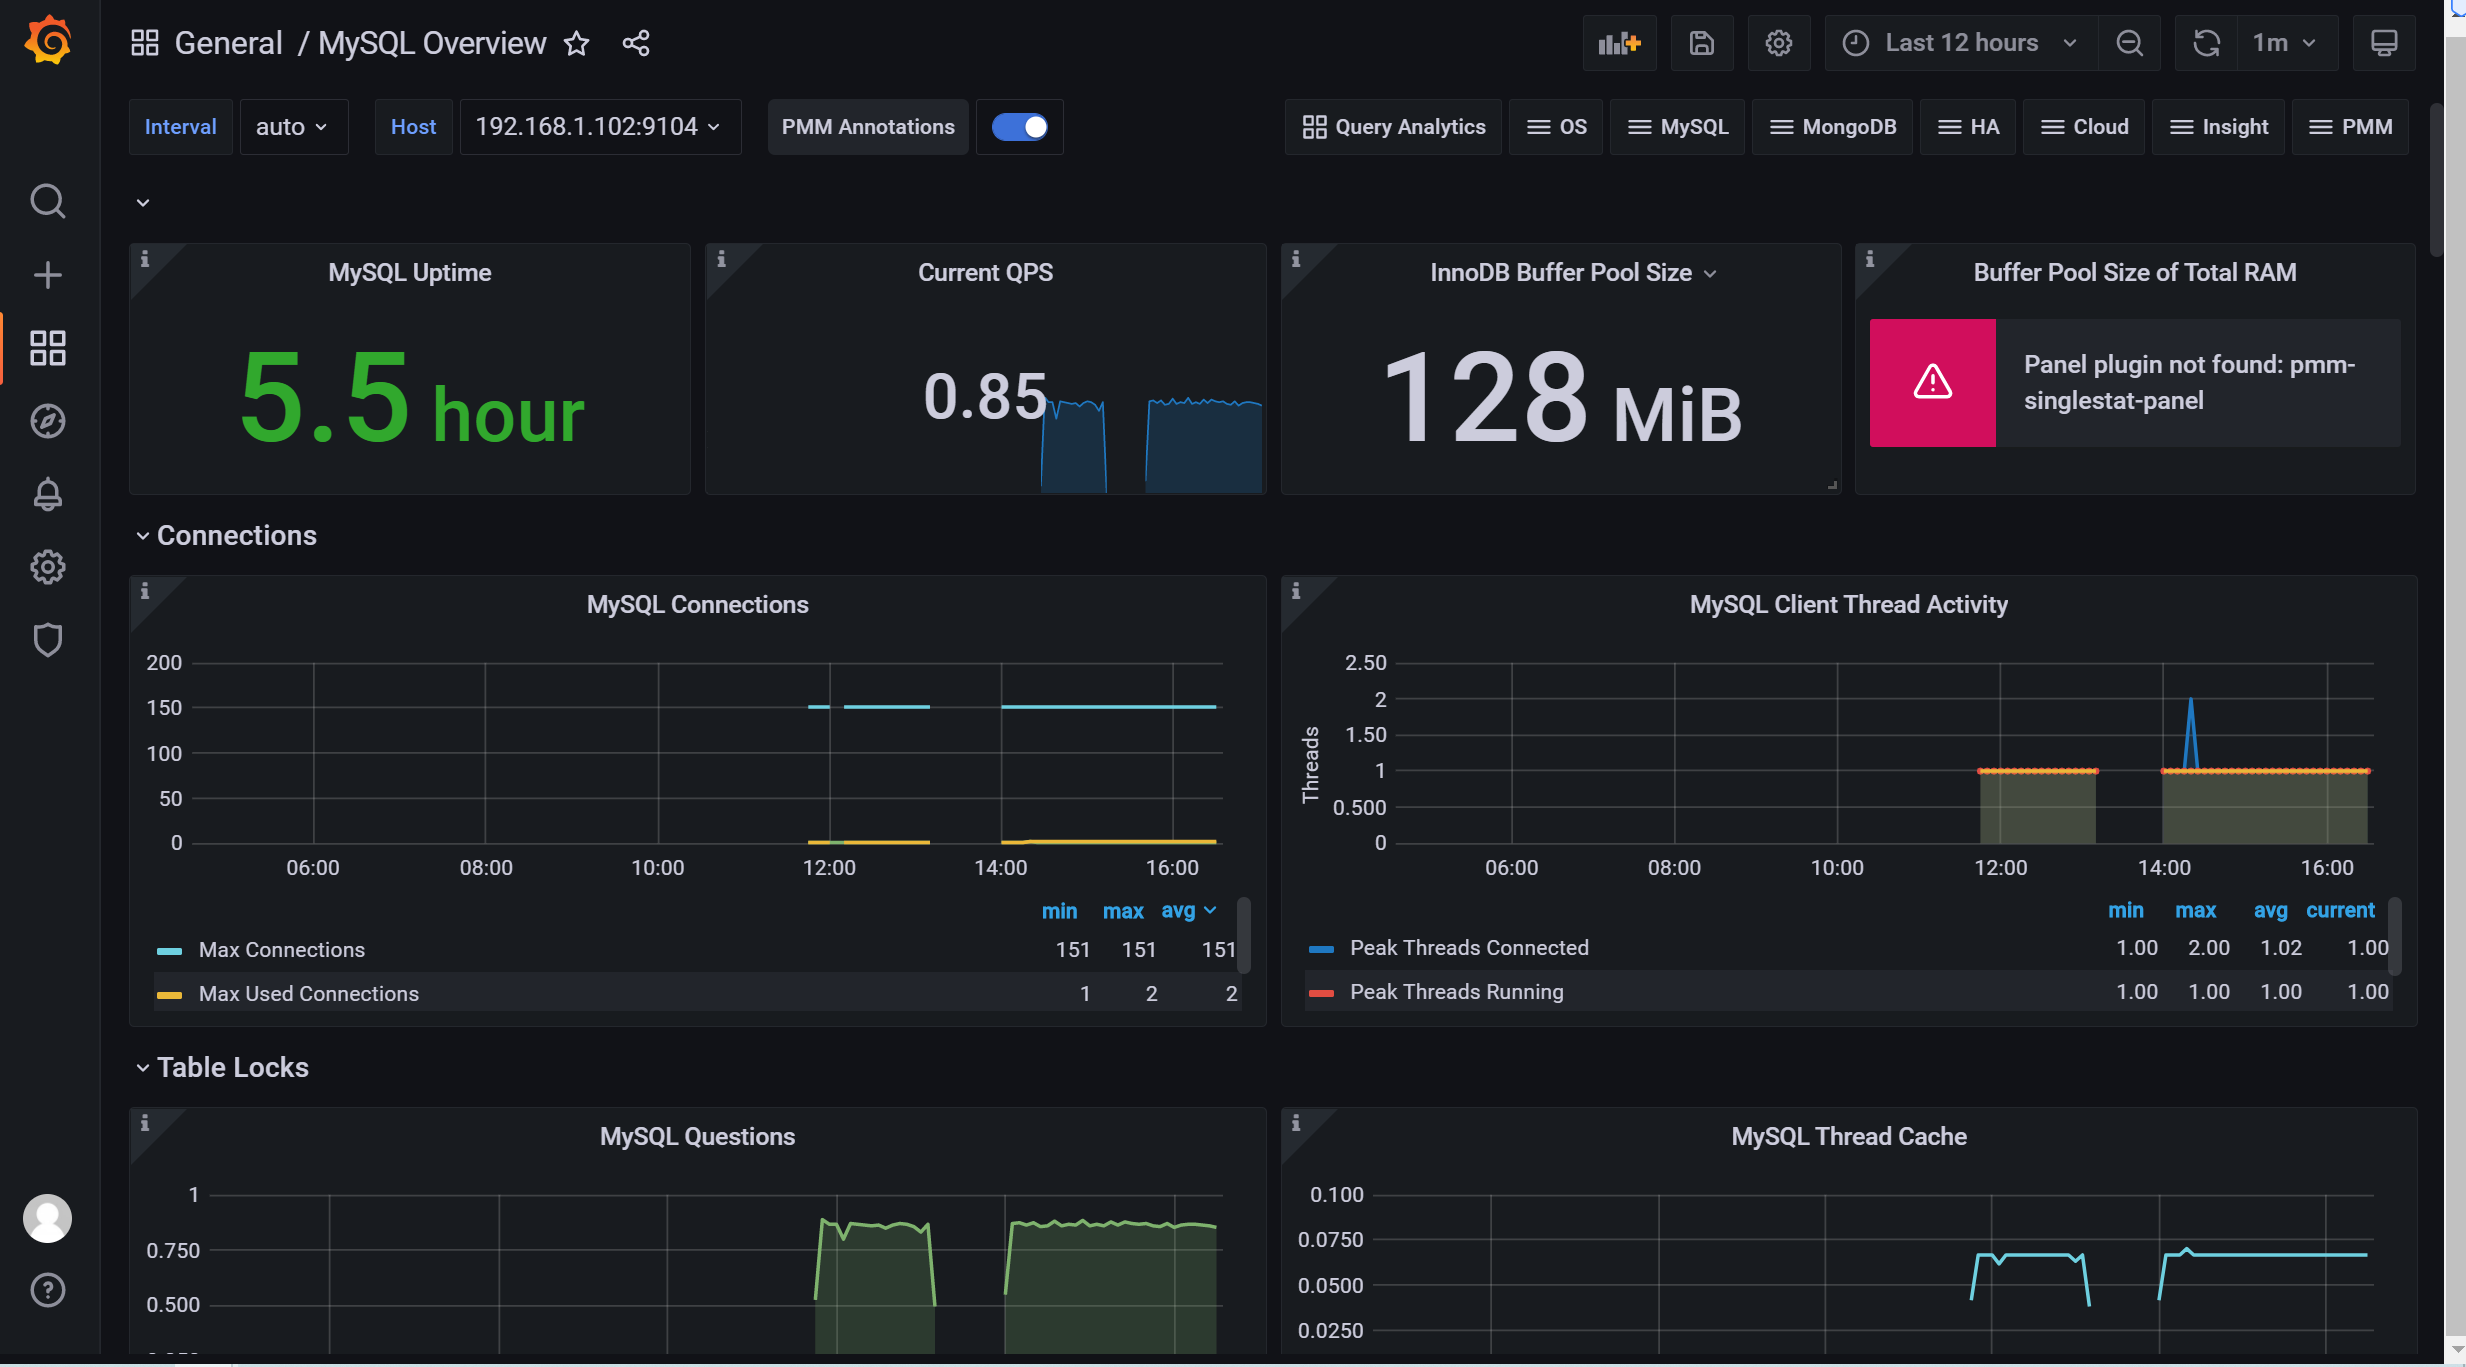
接下来,我们尝试导入“MySQL_Instances_Overview.json”模板文件到grafana中
3.8.1 导入json文件
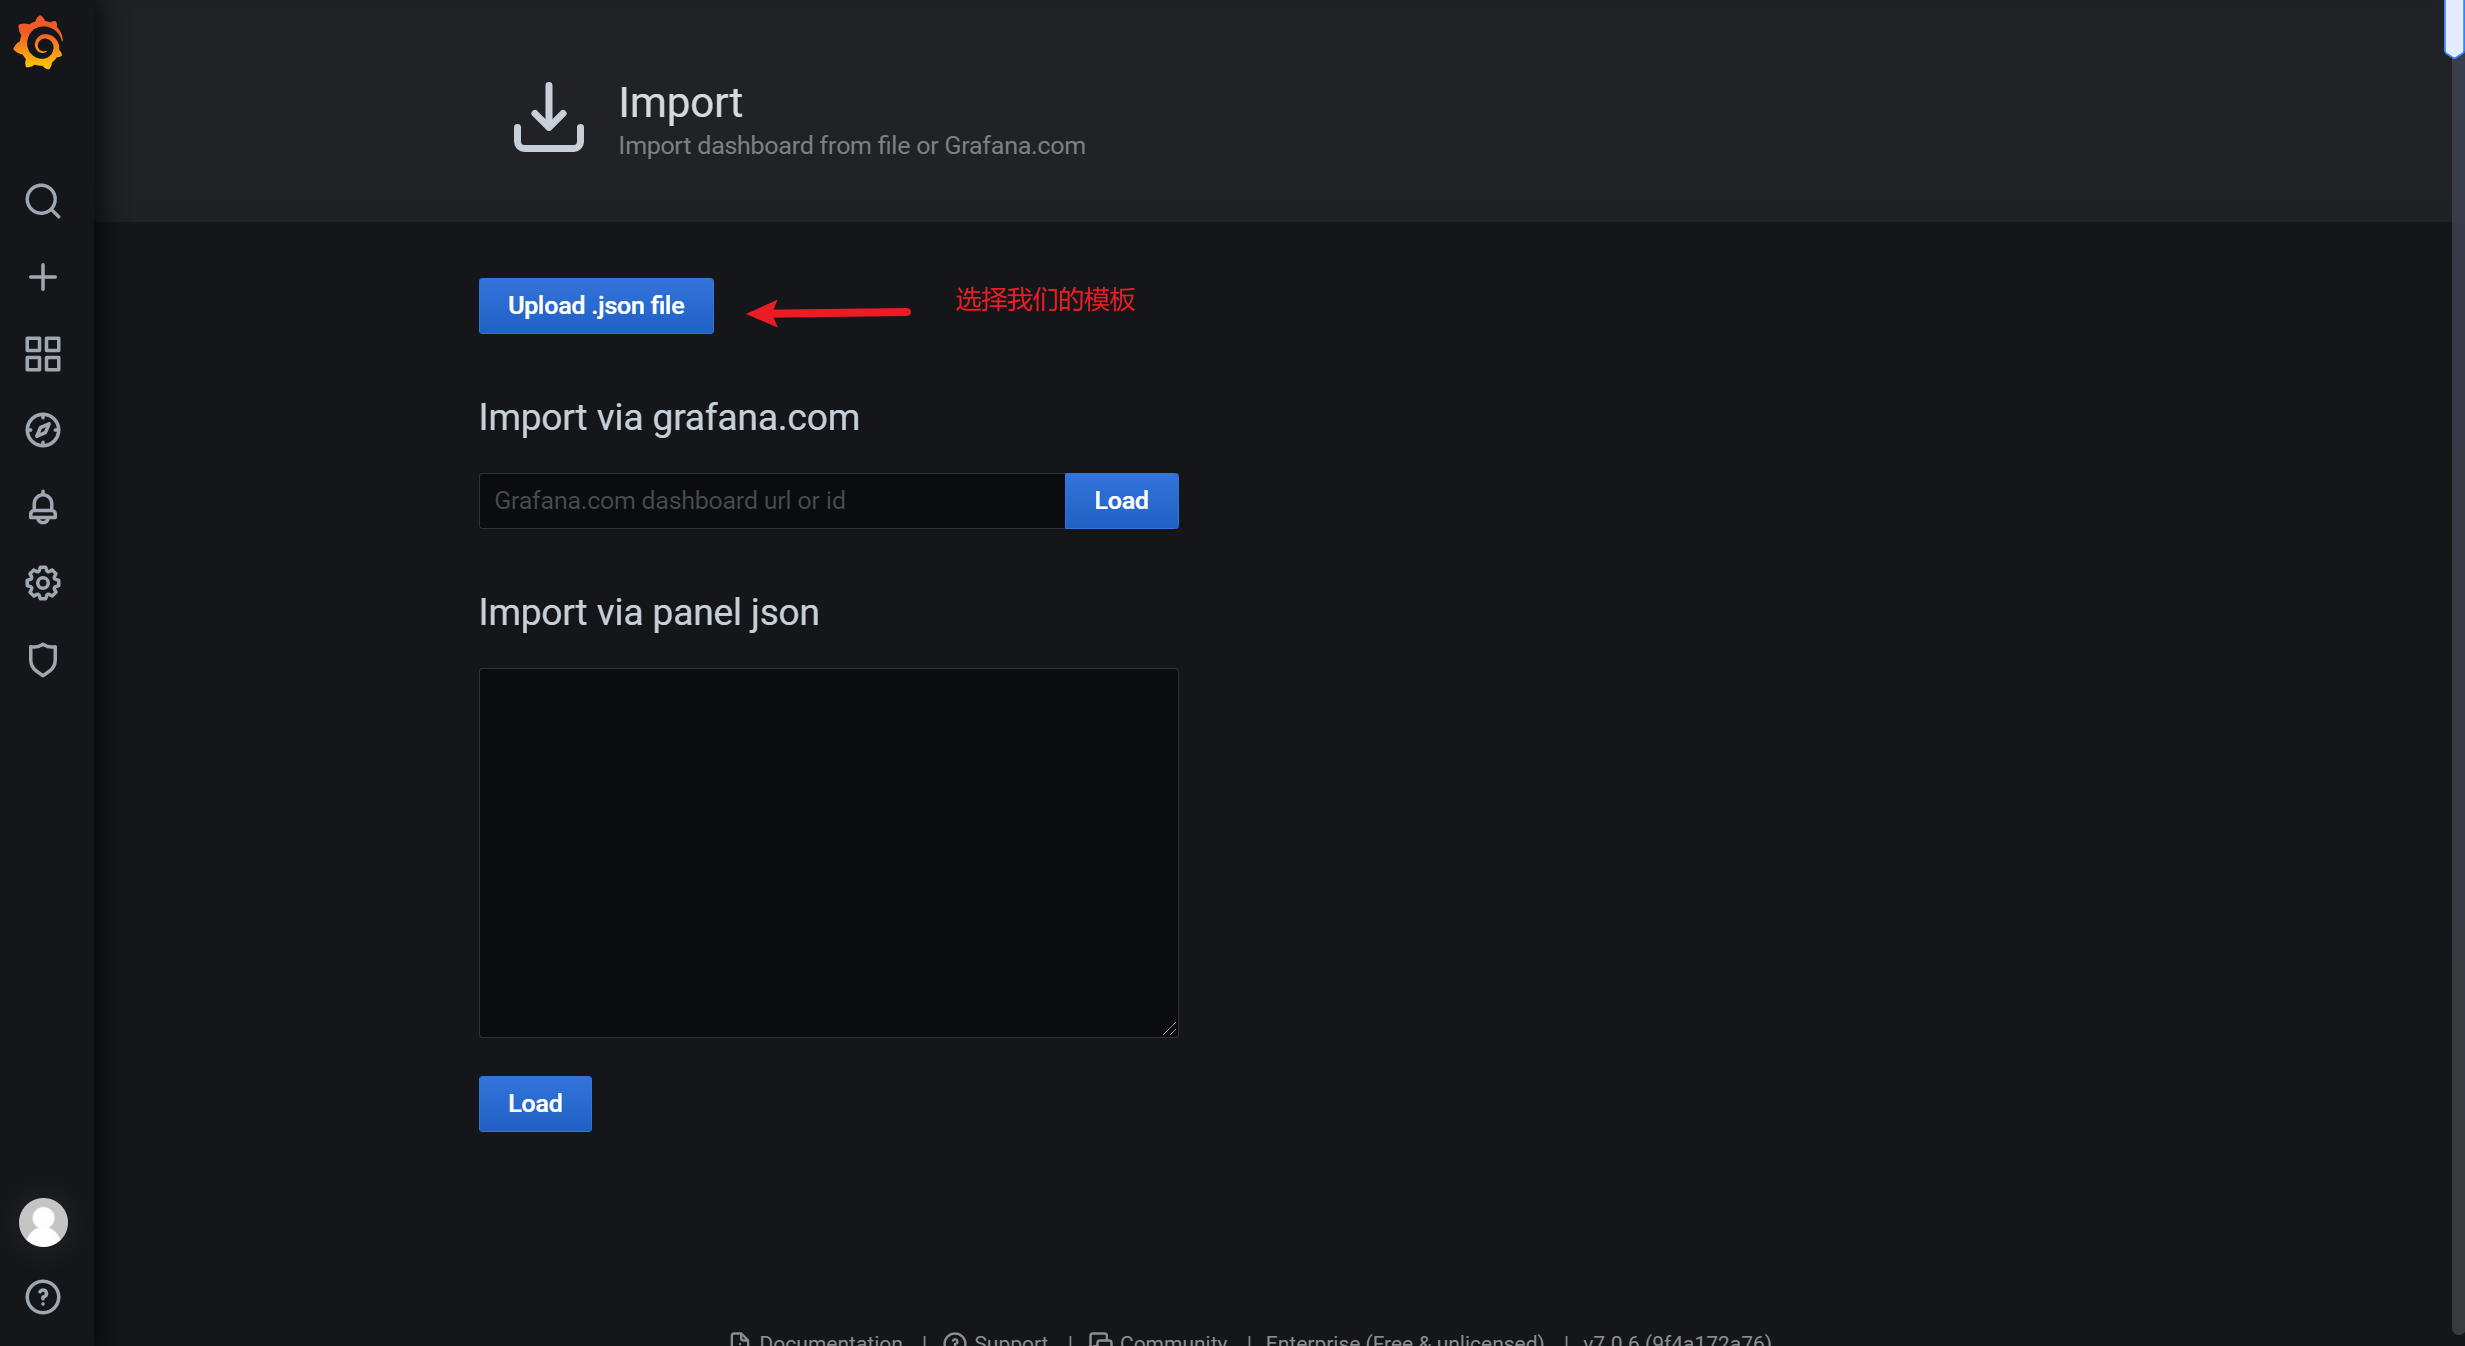
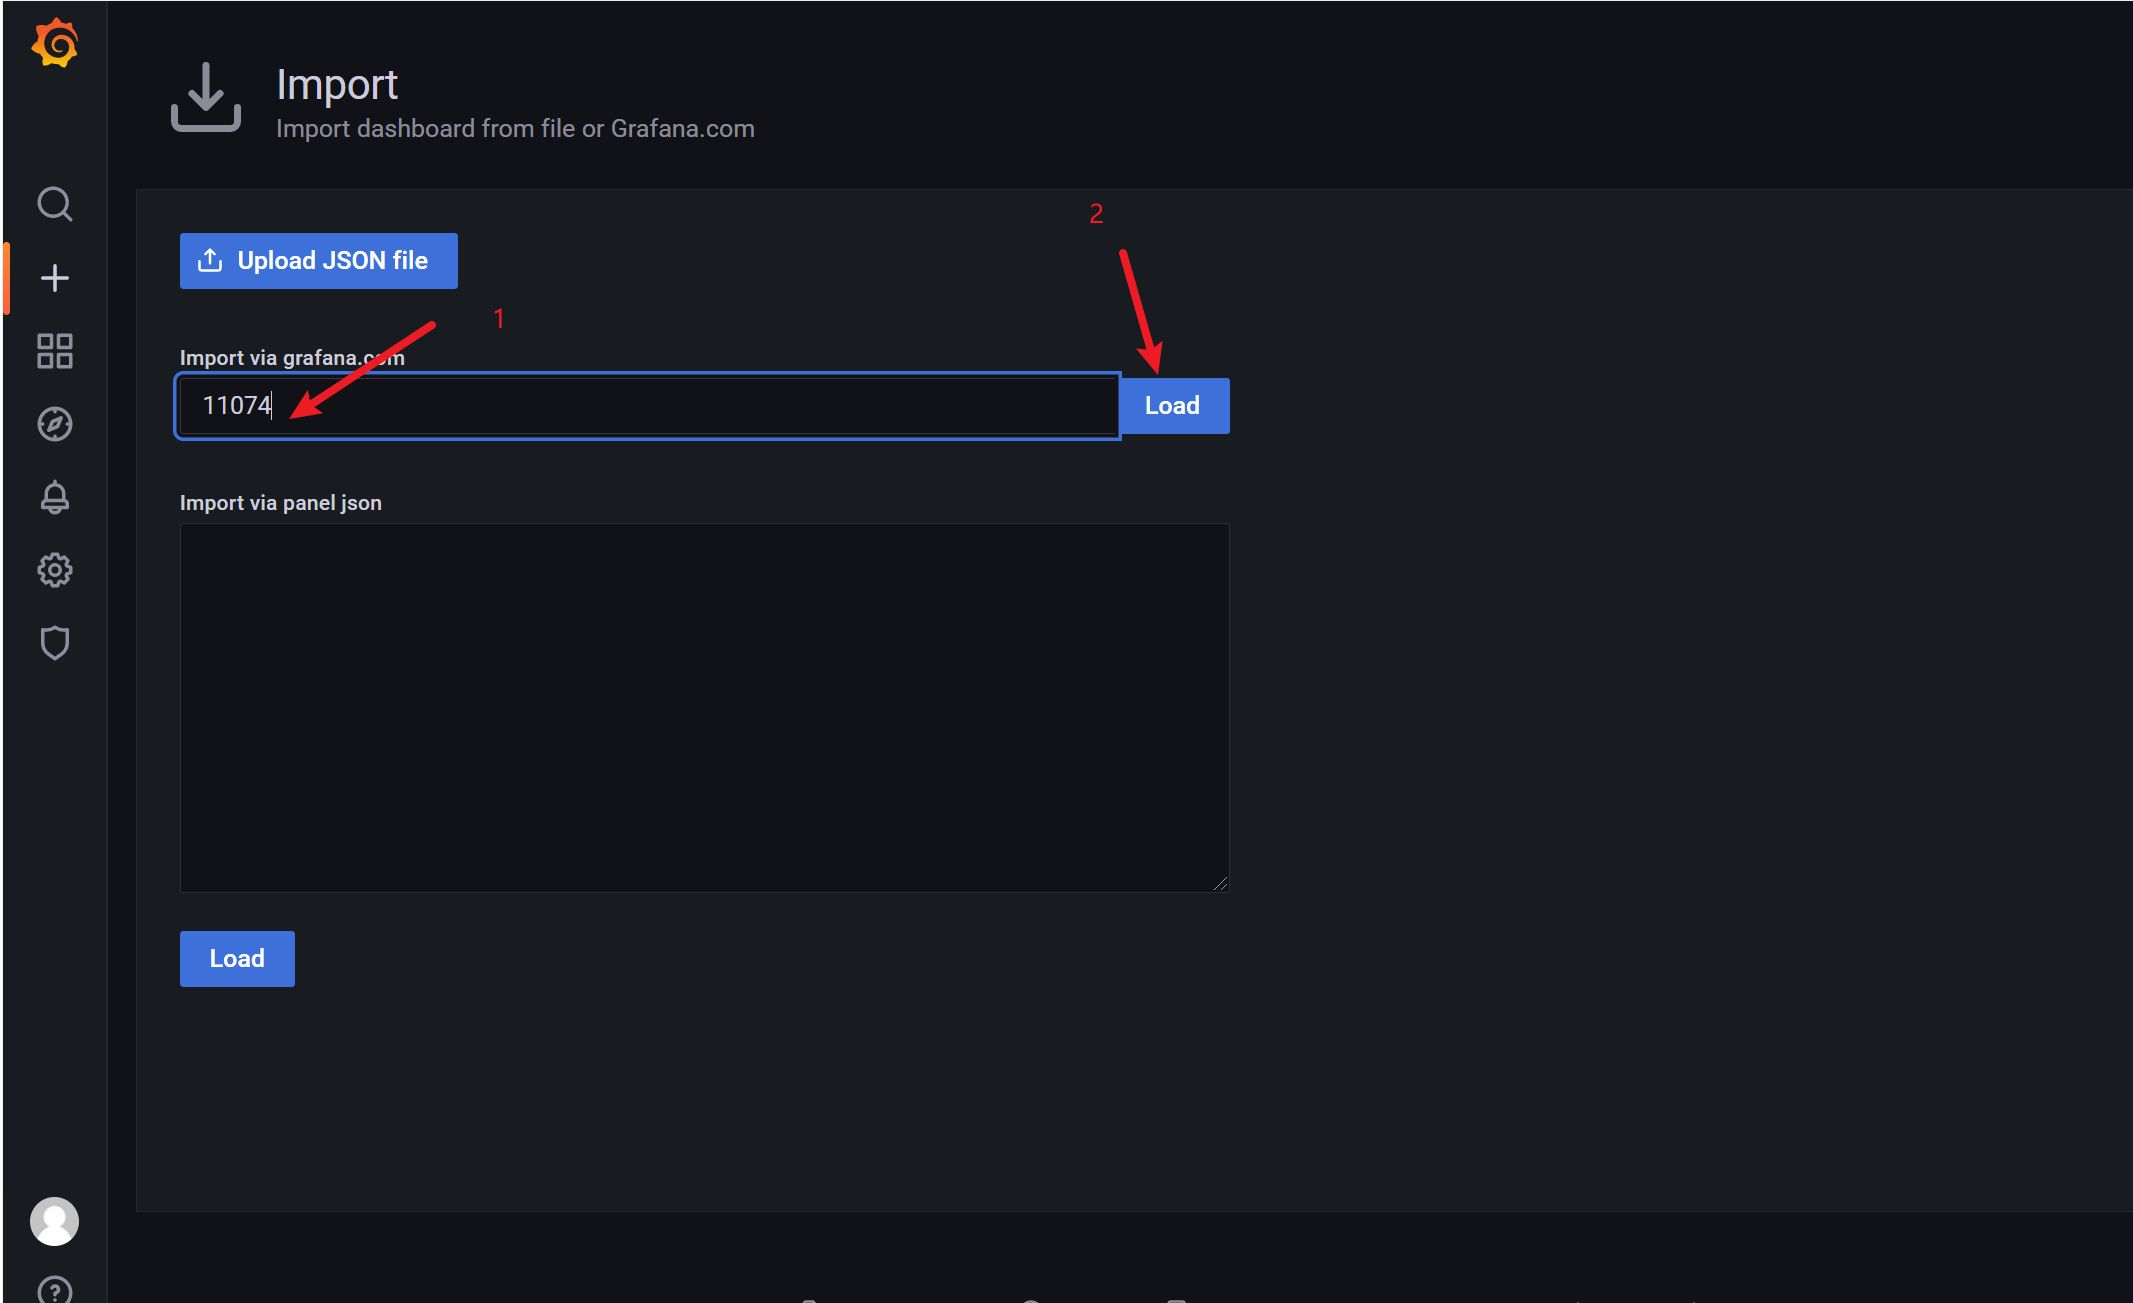
3.8.2 通过 ID的方式导入模板
https://grafana.com/grafana/dashboards/
常用模板
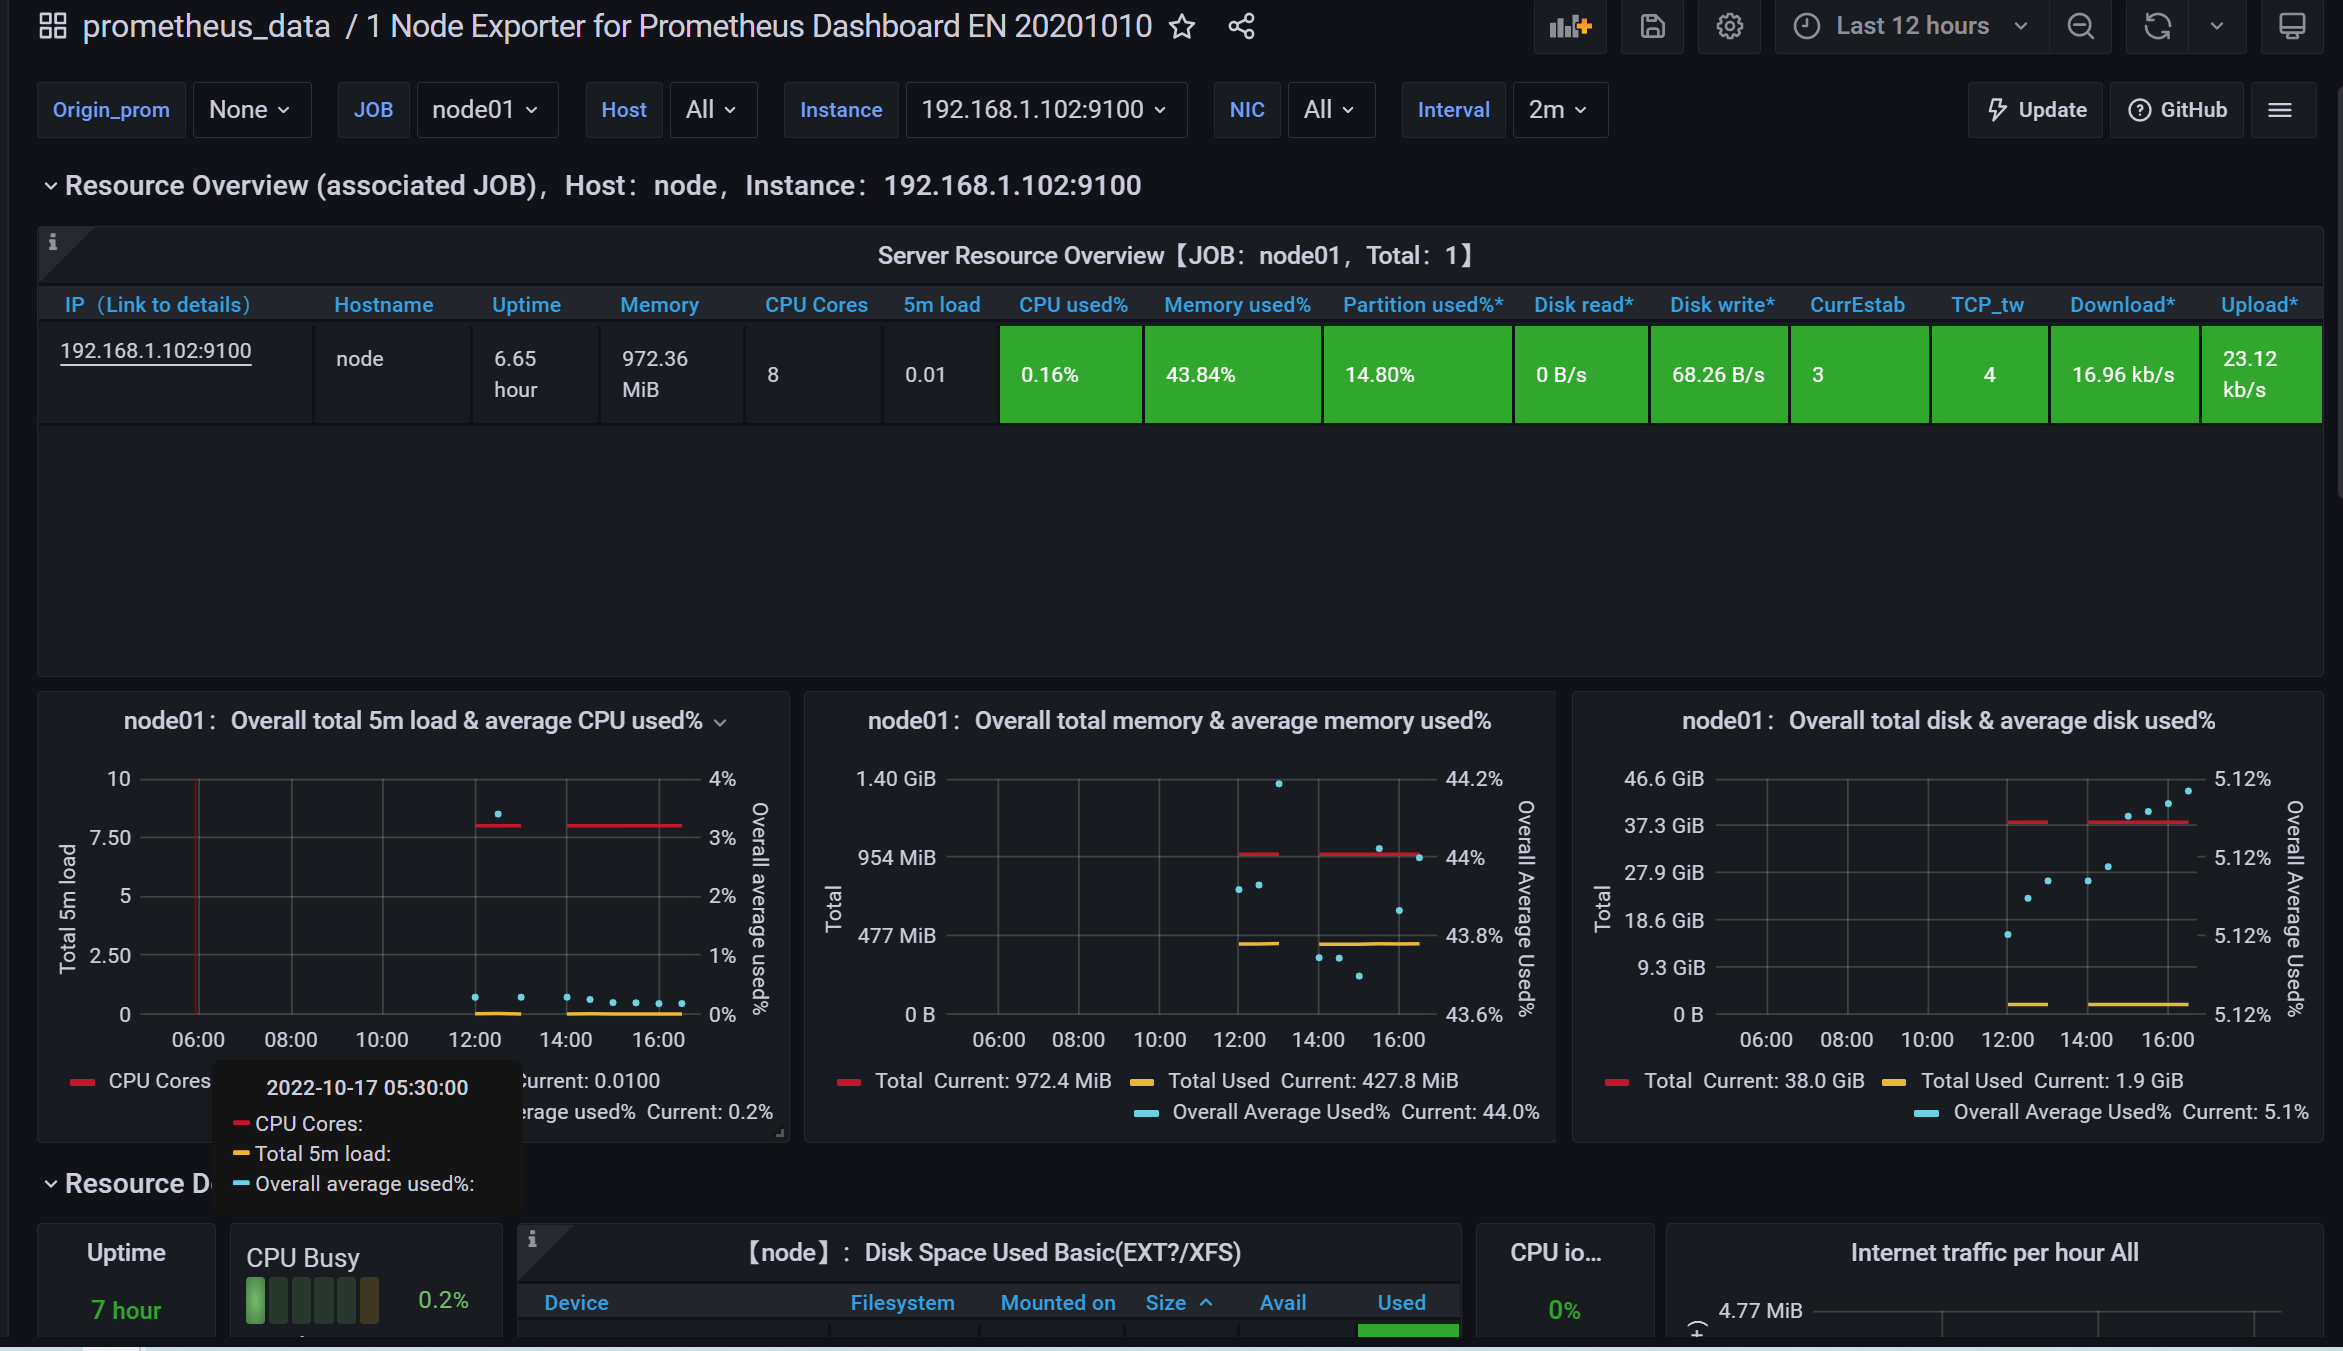
https://grafana.com/grafana/dashboards/11074 主机监控
https://grafana.com/grafana/dashboards/9276 主机监控
https://grafana.com/grafana/dashboards/7362 数据库监控
https://grafana.com/grafana/dashboards/8919 服务器系统性能监控
https://grafana.com/grafana/dashboards/4701 微服务性能监控
https://grafana.com/grafana/dashboards/893 docker环境性能监控
https://grafana.com/grafana/dashboards/266 elasticsearch监控
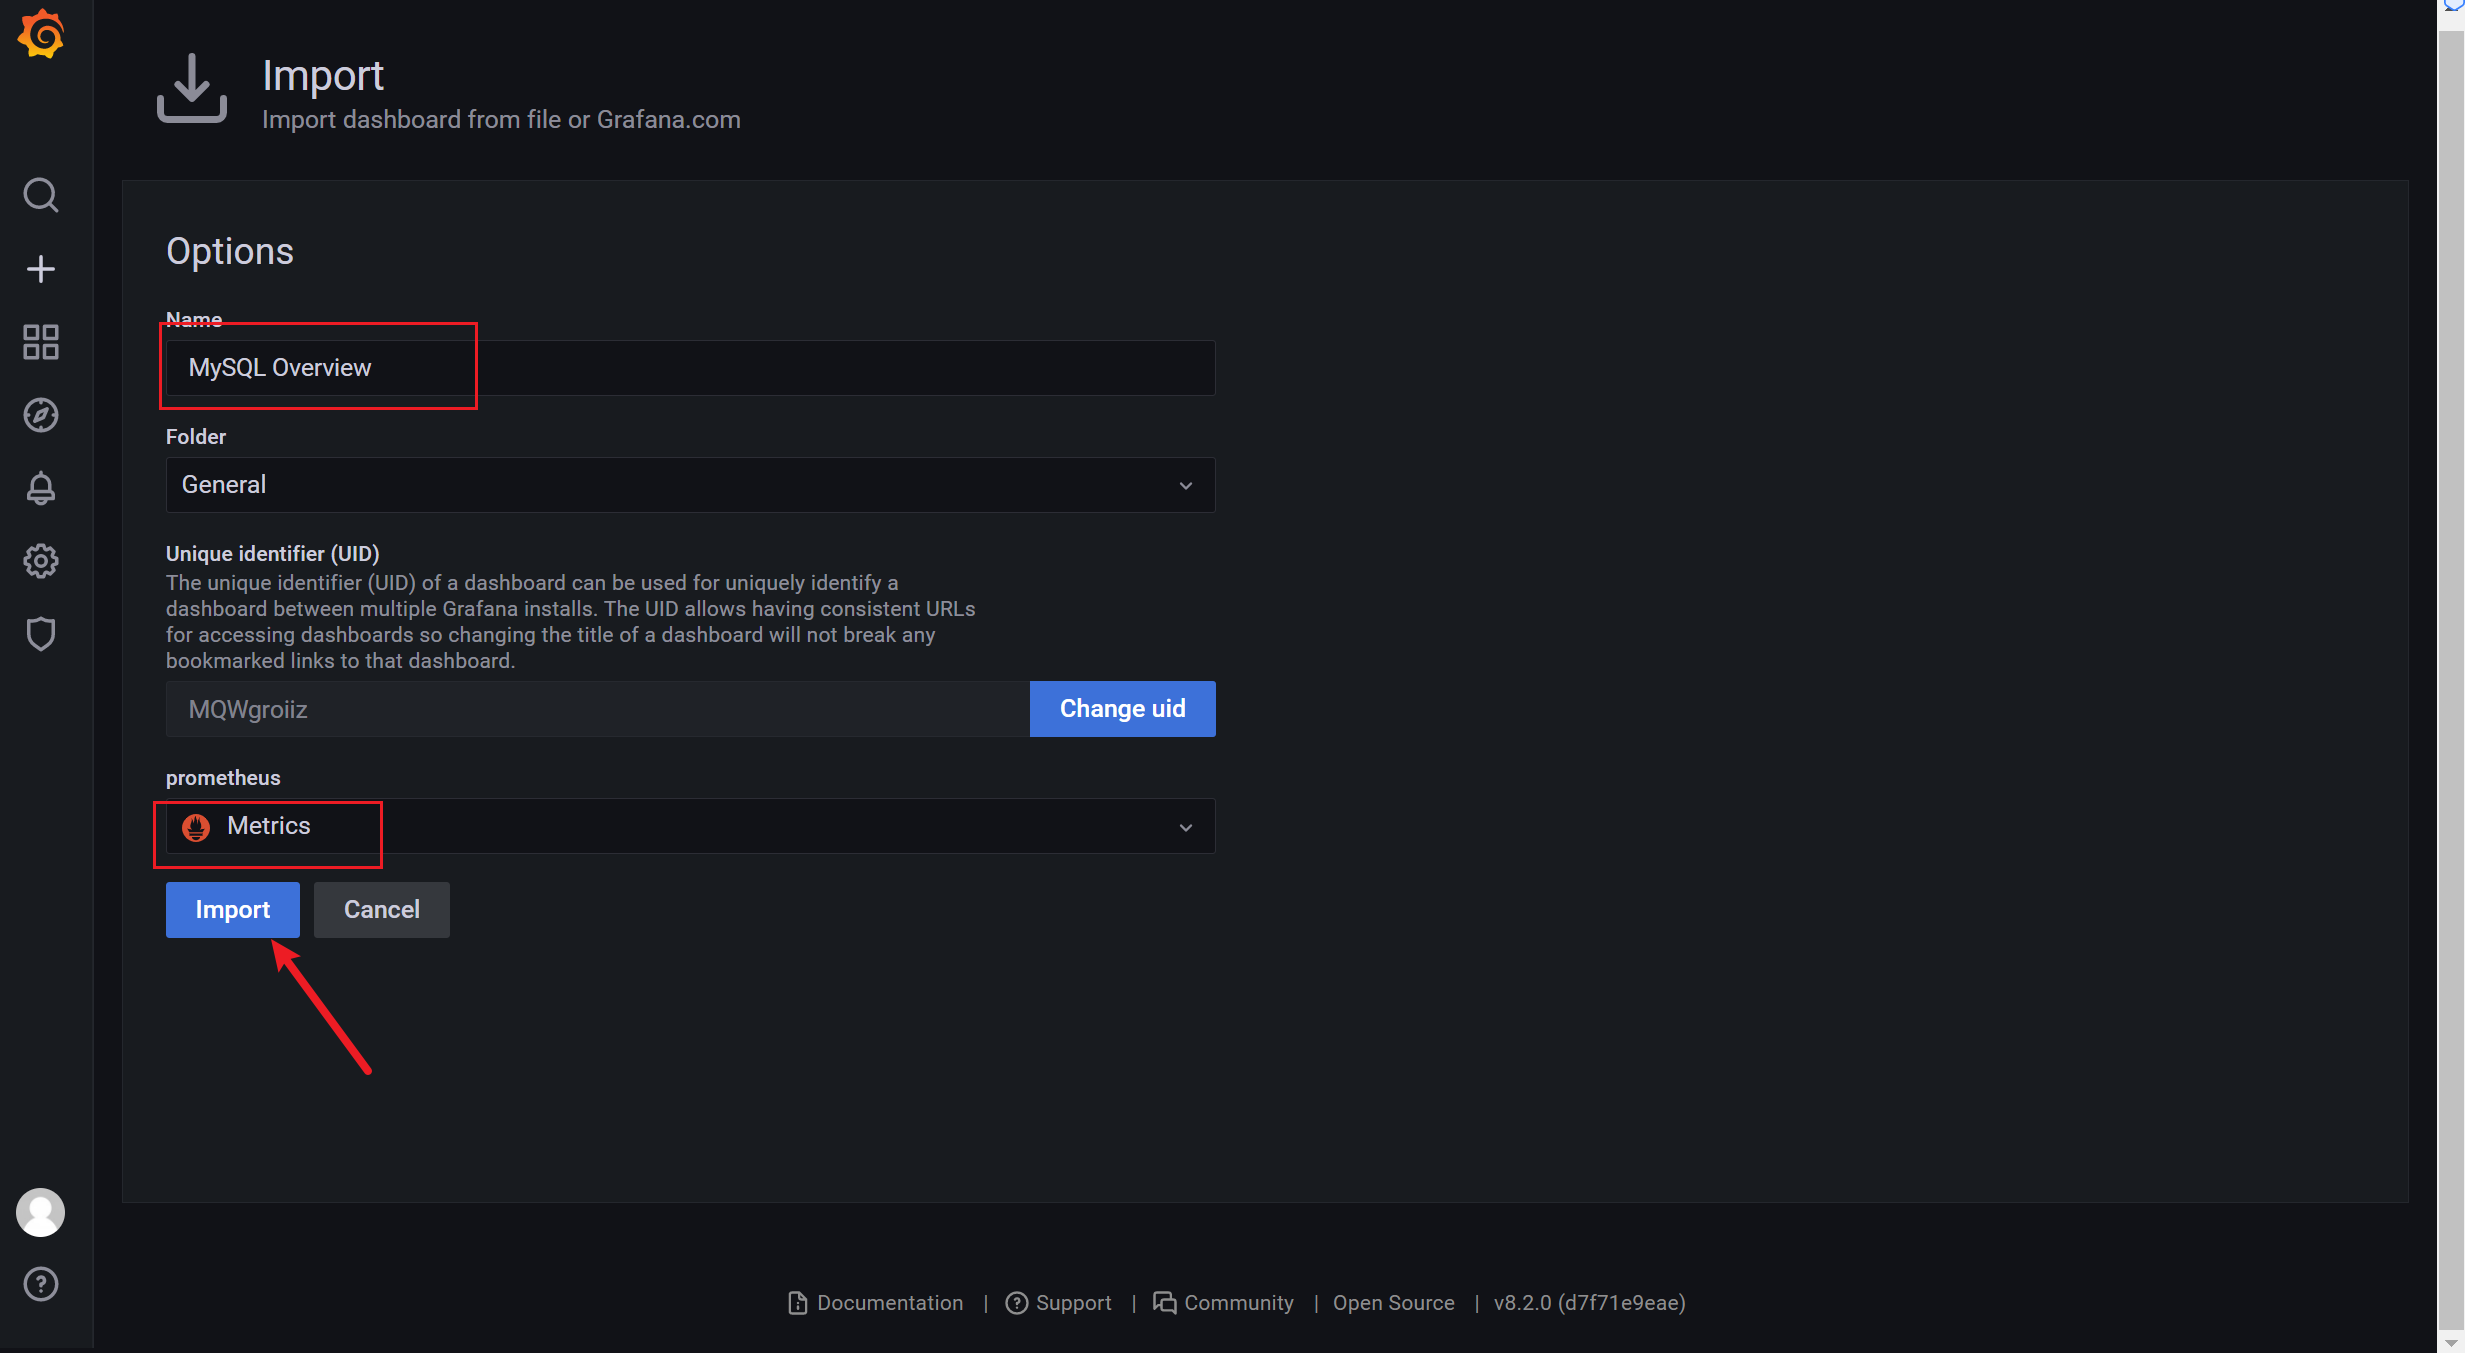
这种方式是直接在grafana的官方网站上拉取的json模板,点击 Load 会出现如下界面:
将 Name 改成你希望定义的名字,在 VictoriaMetrics 位置选择之前创建的 Prometheus 数据源,如下图:
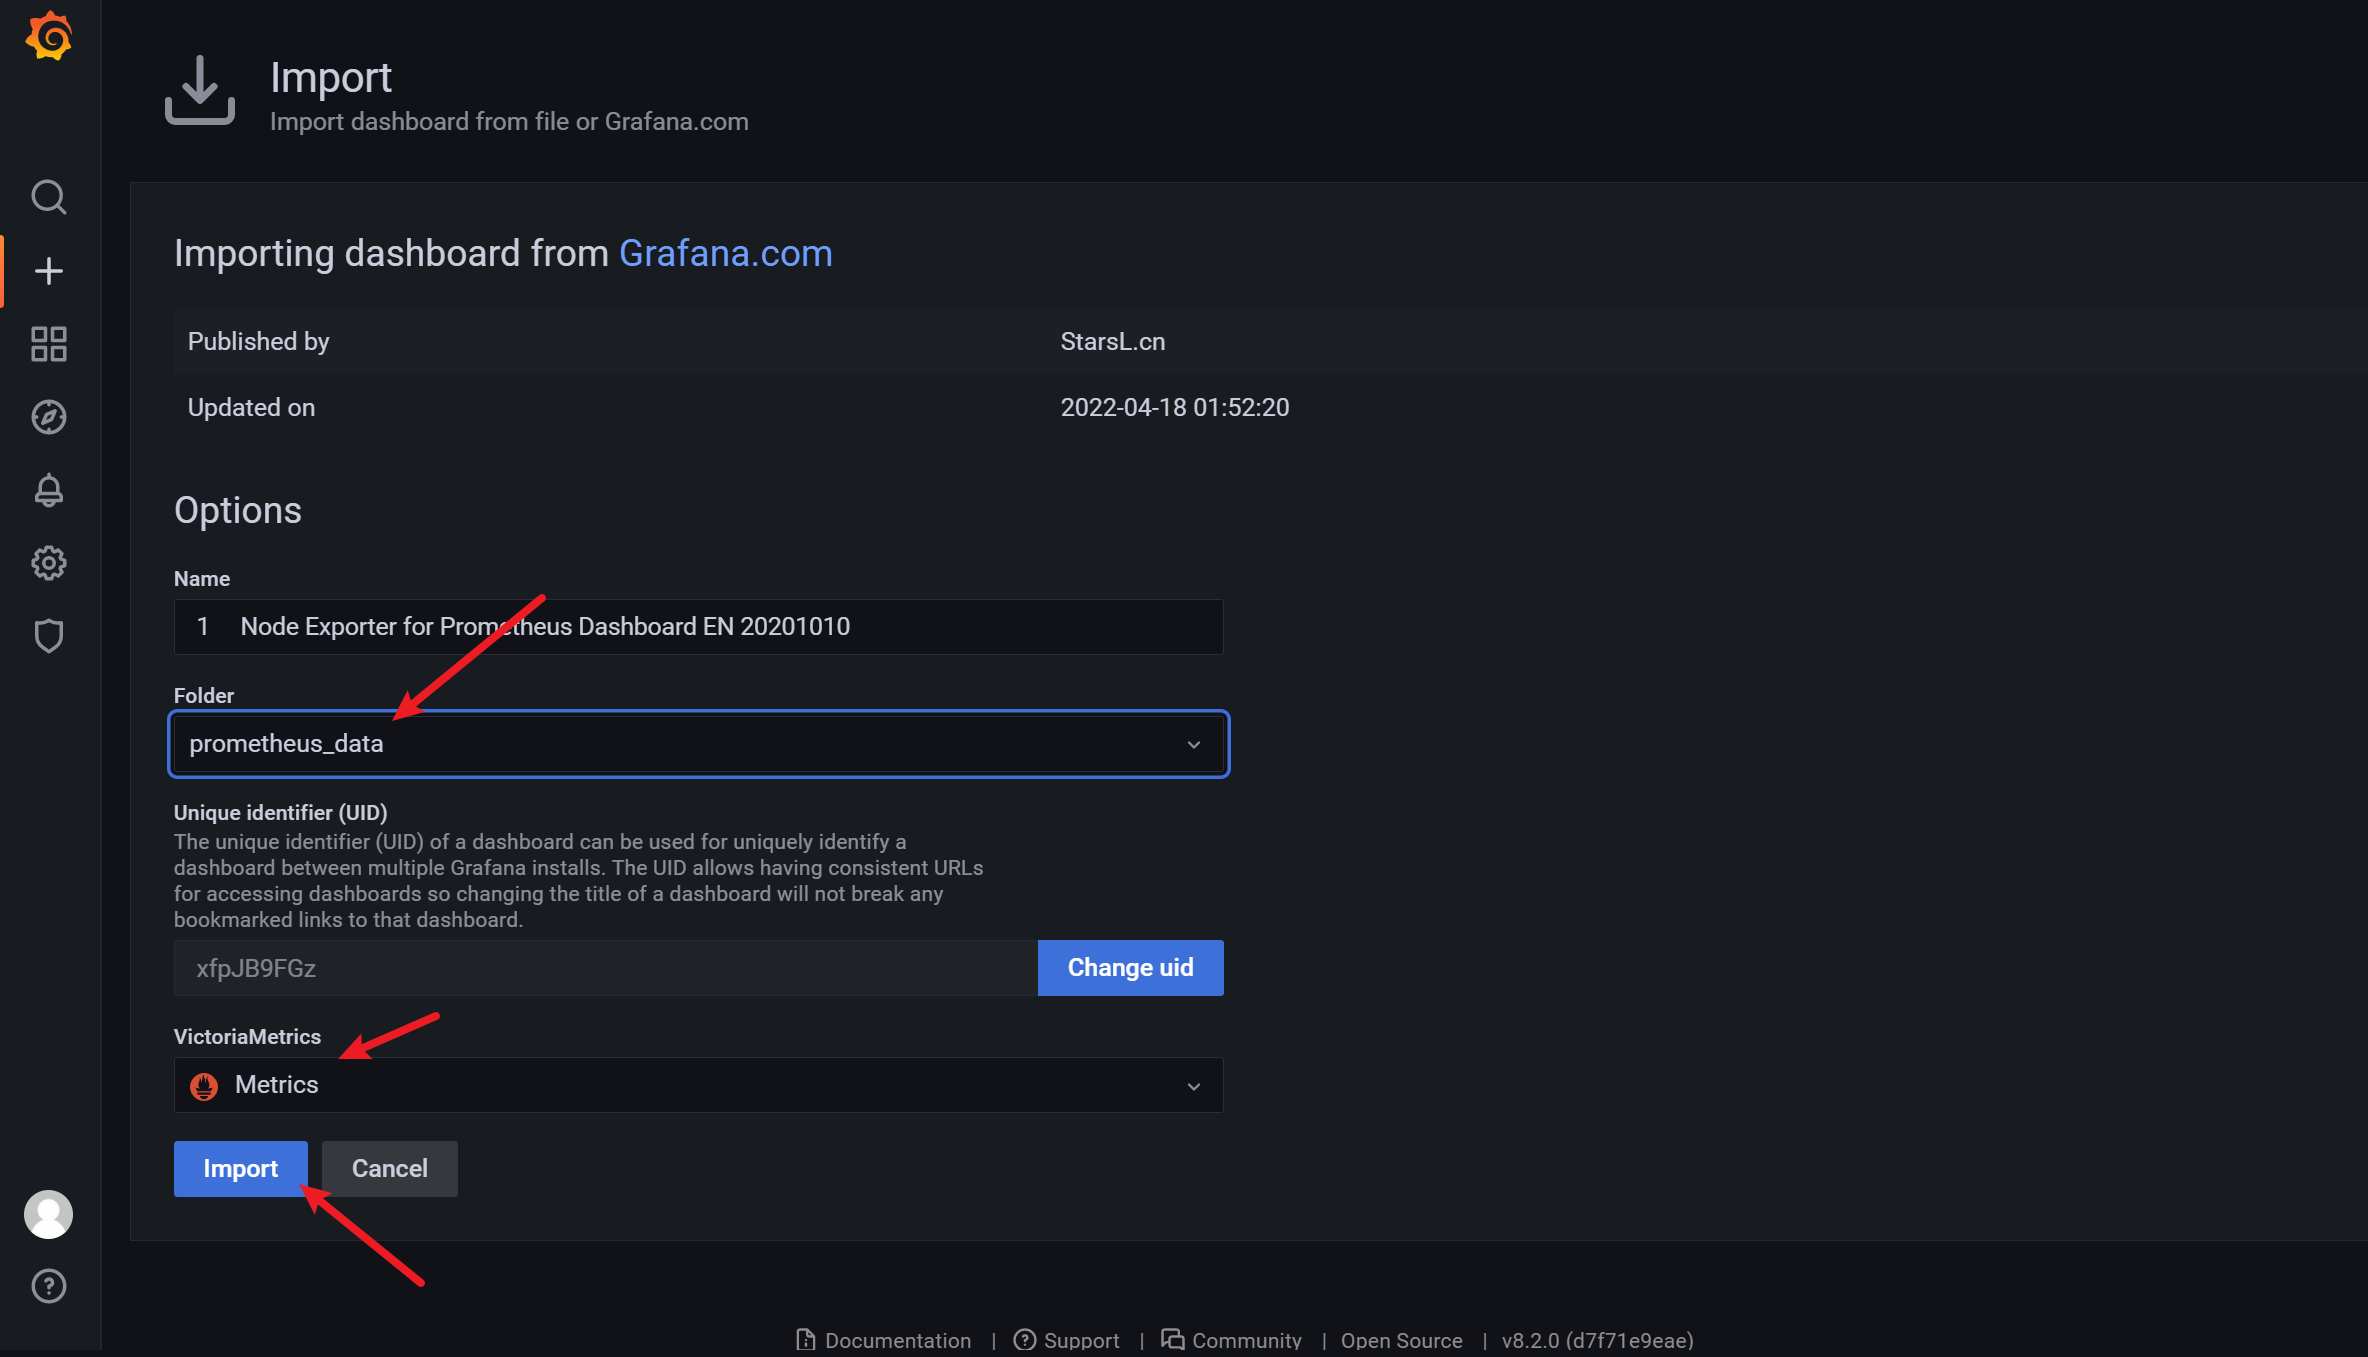
点击 “Import”,会自动跳转到如下界面:
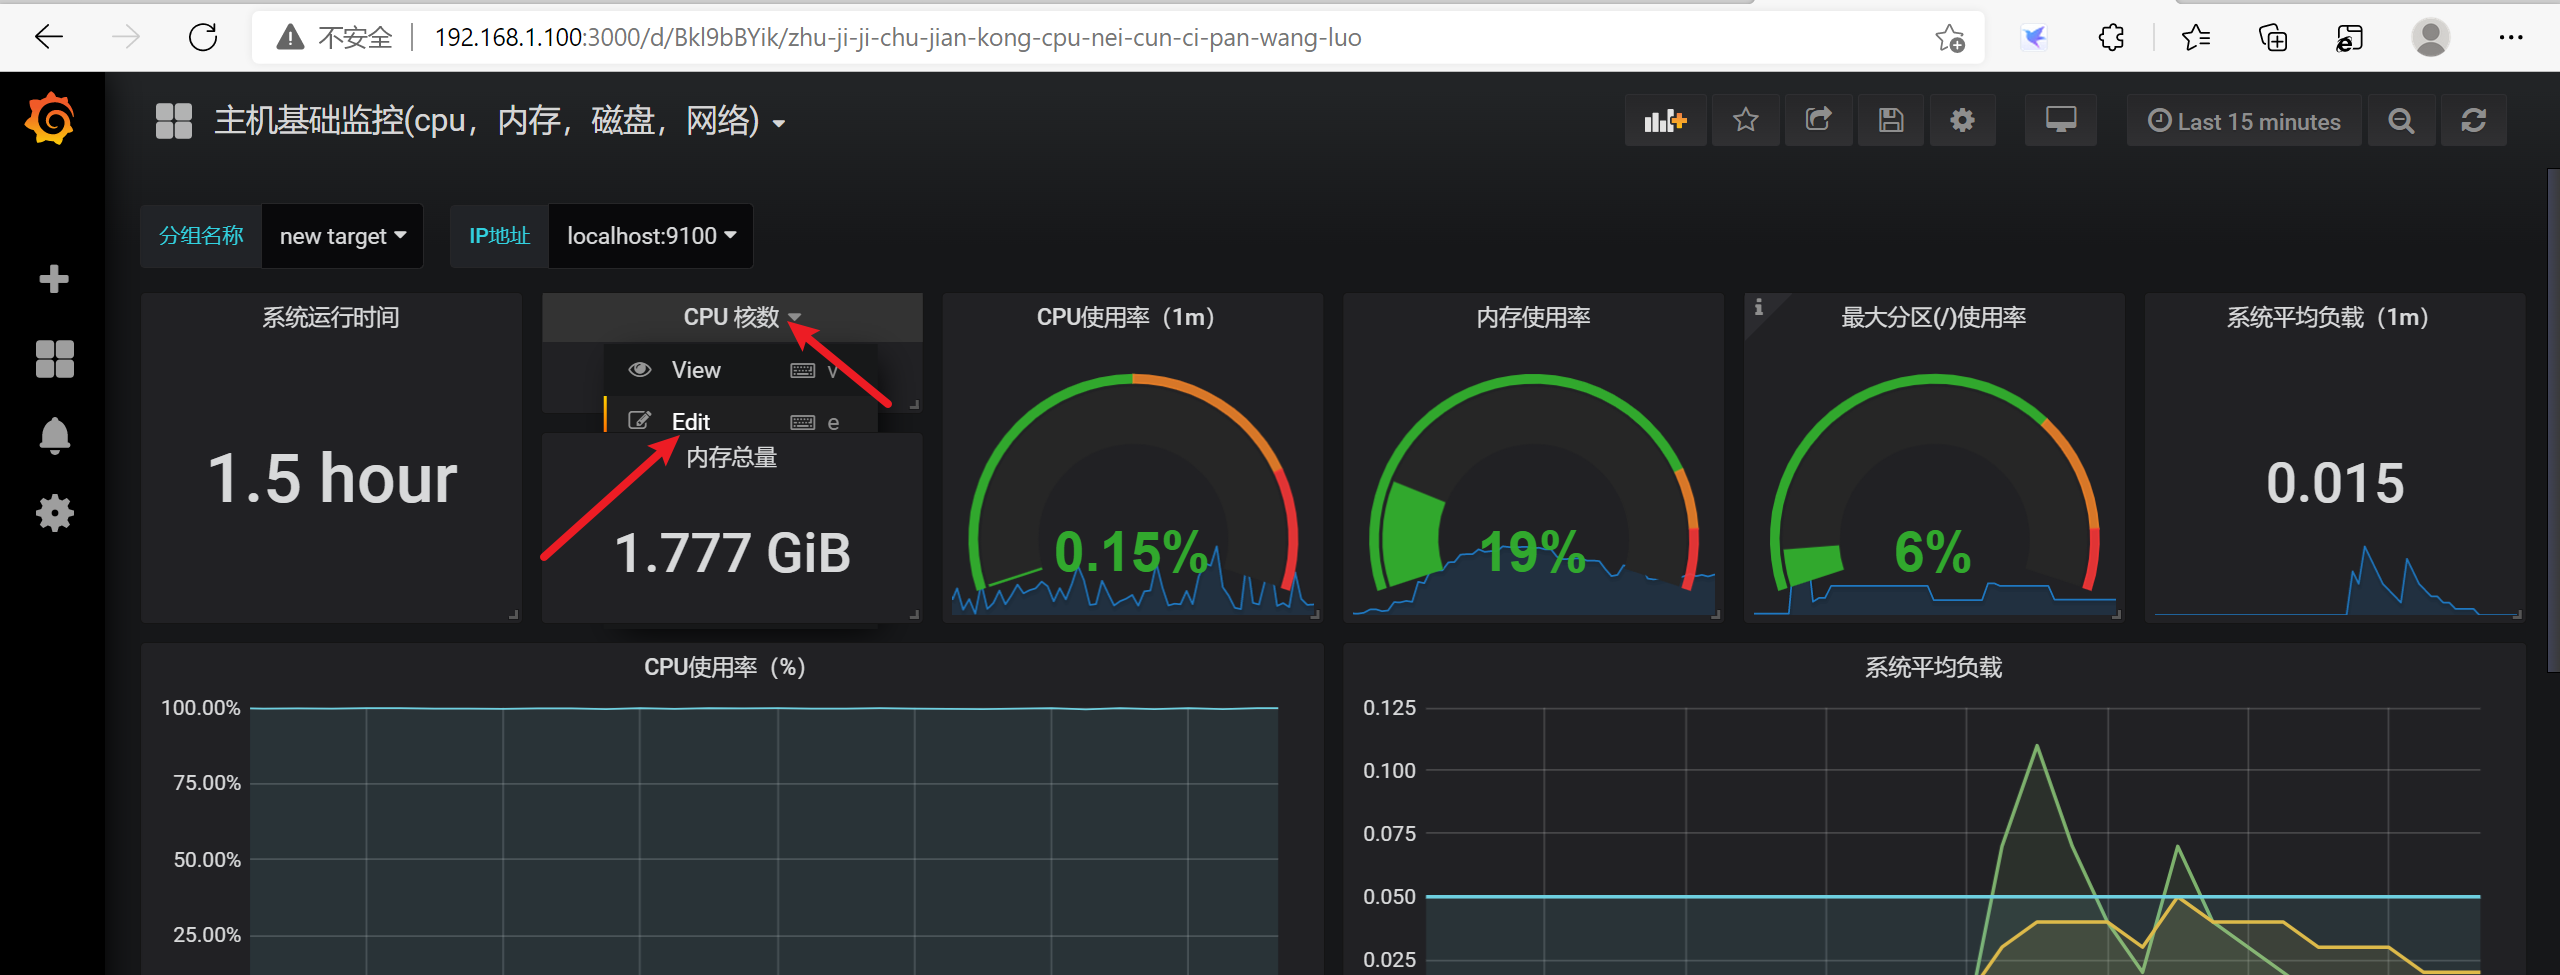
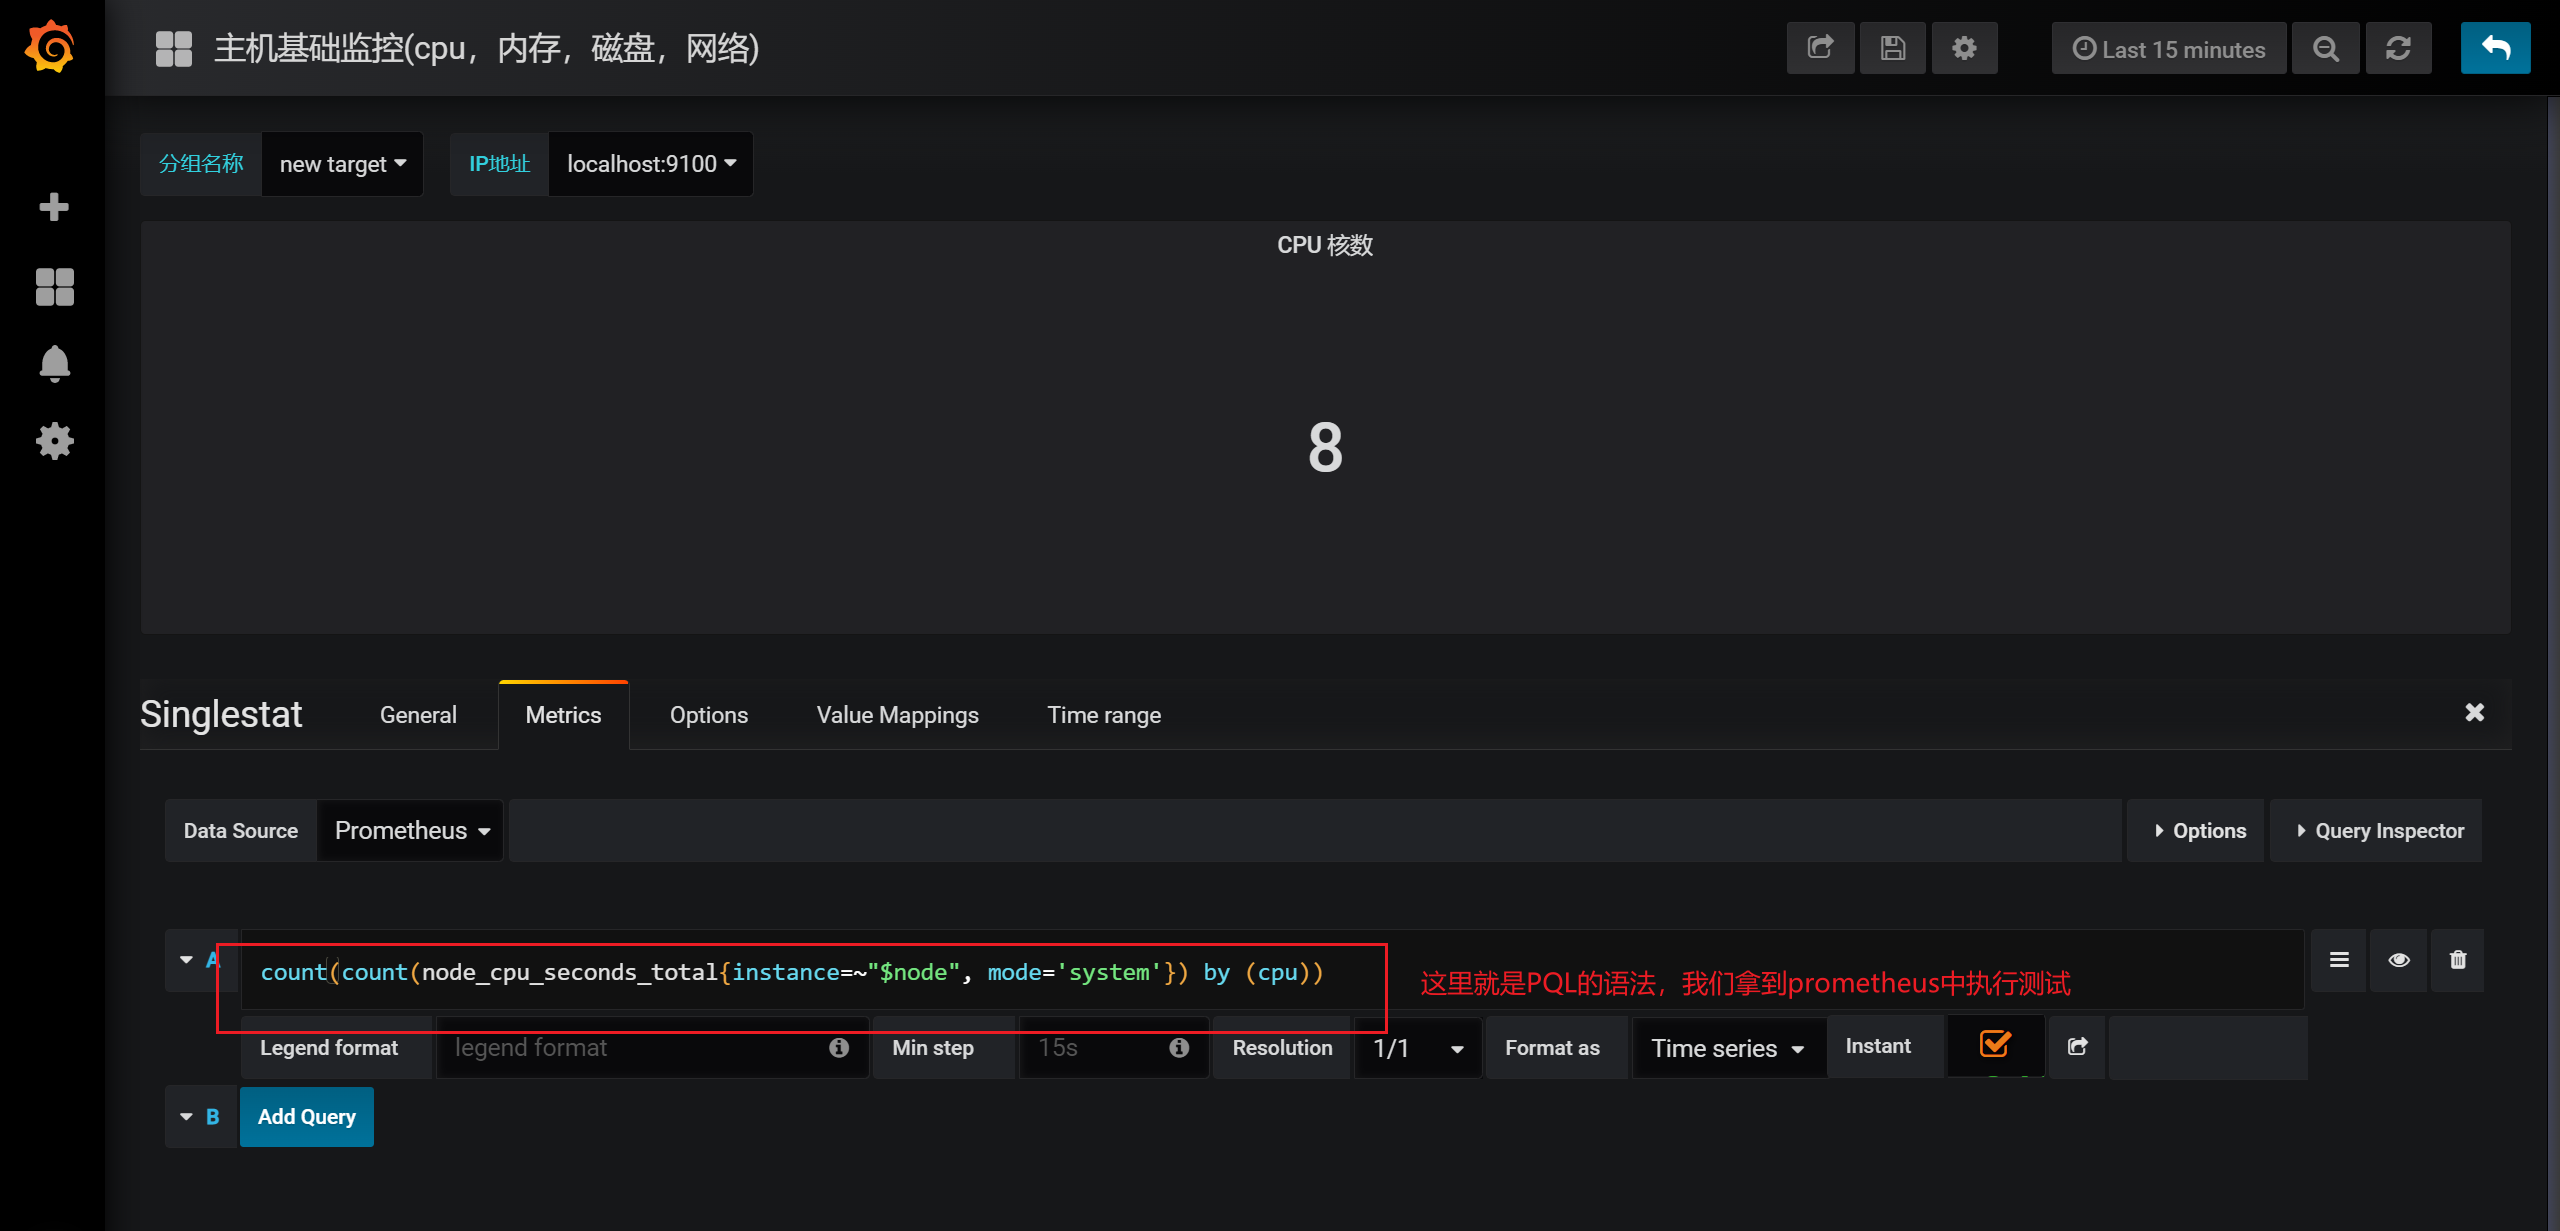
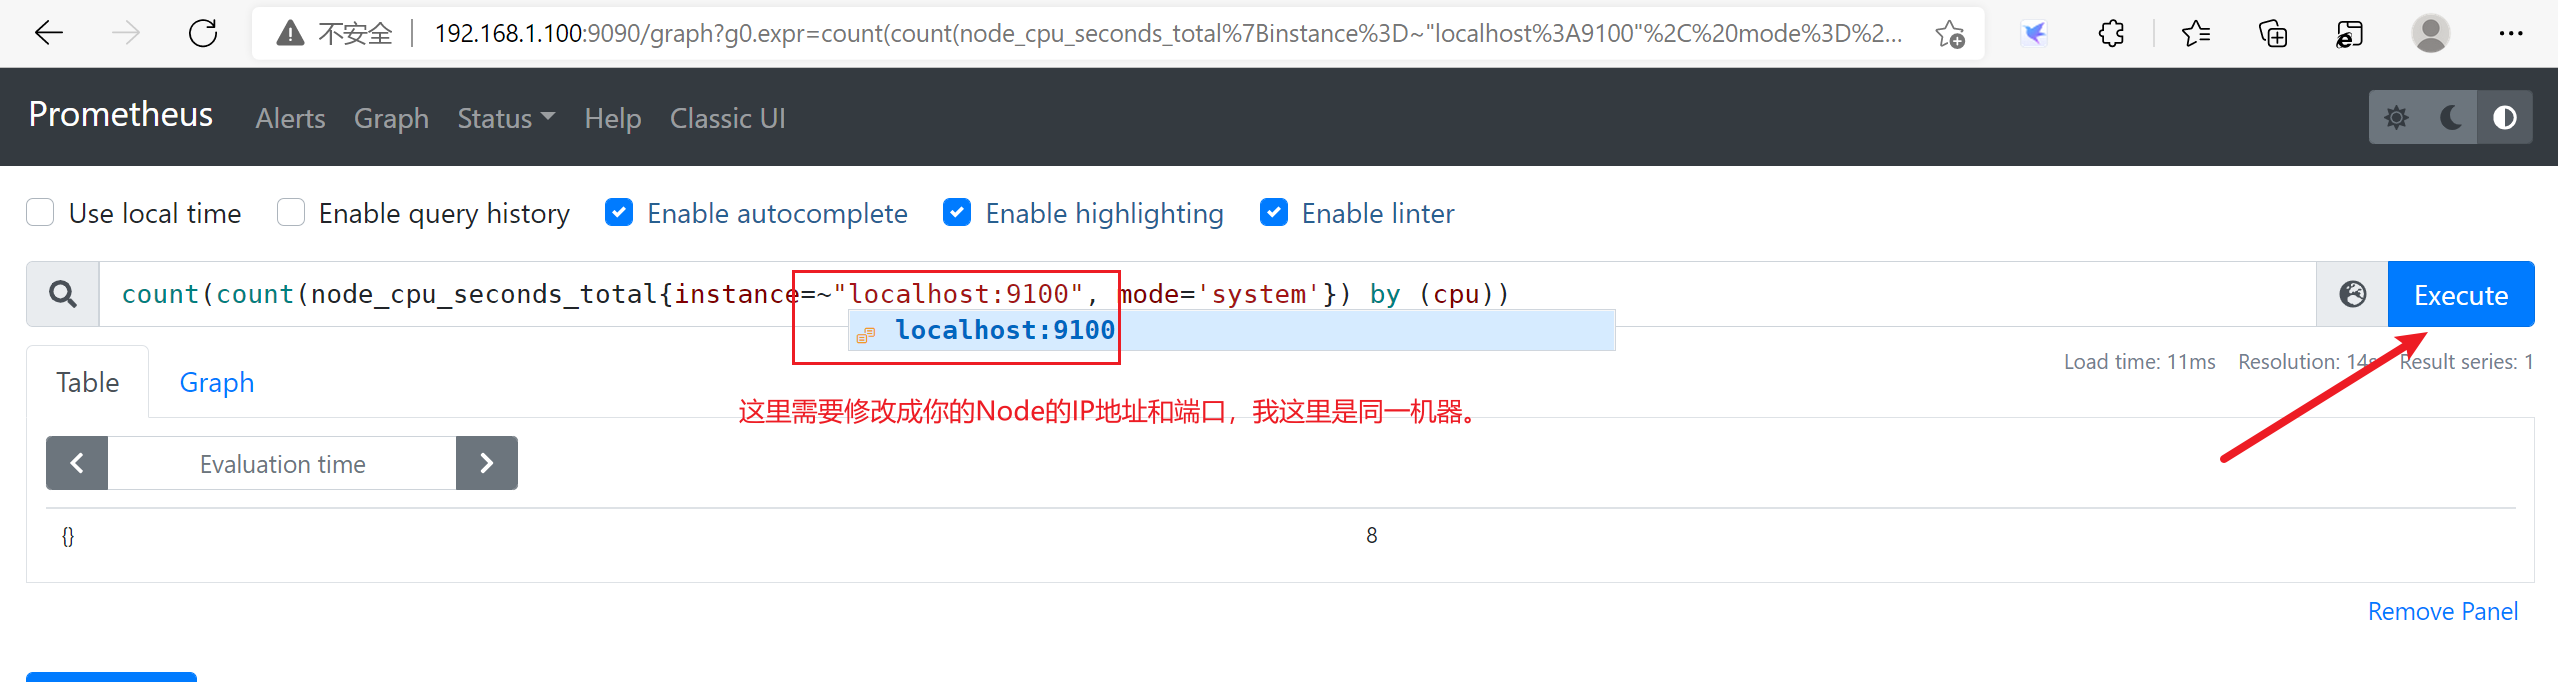
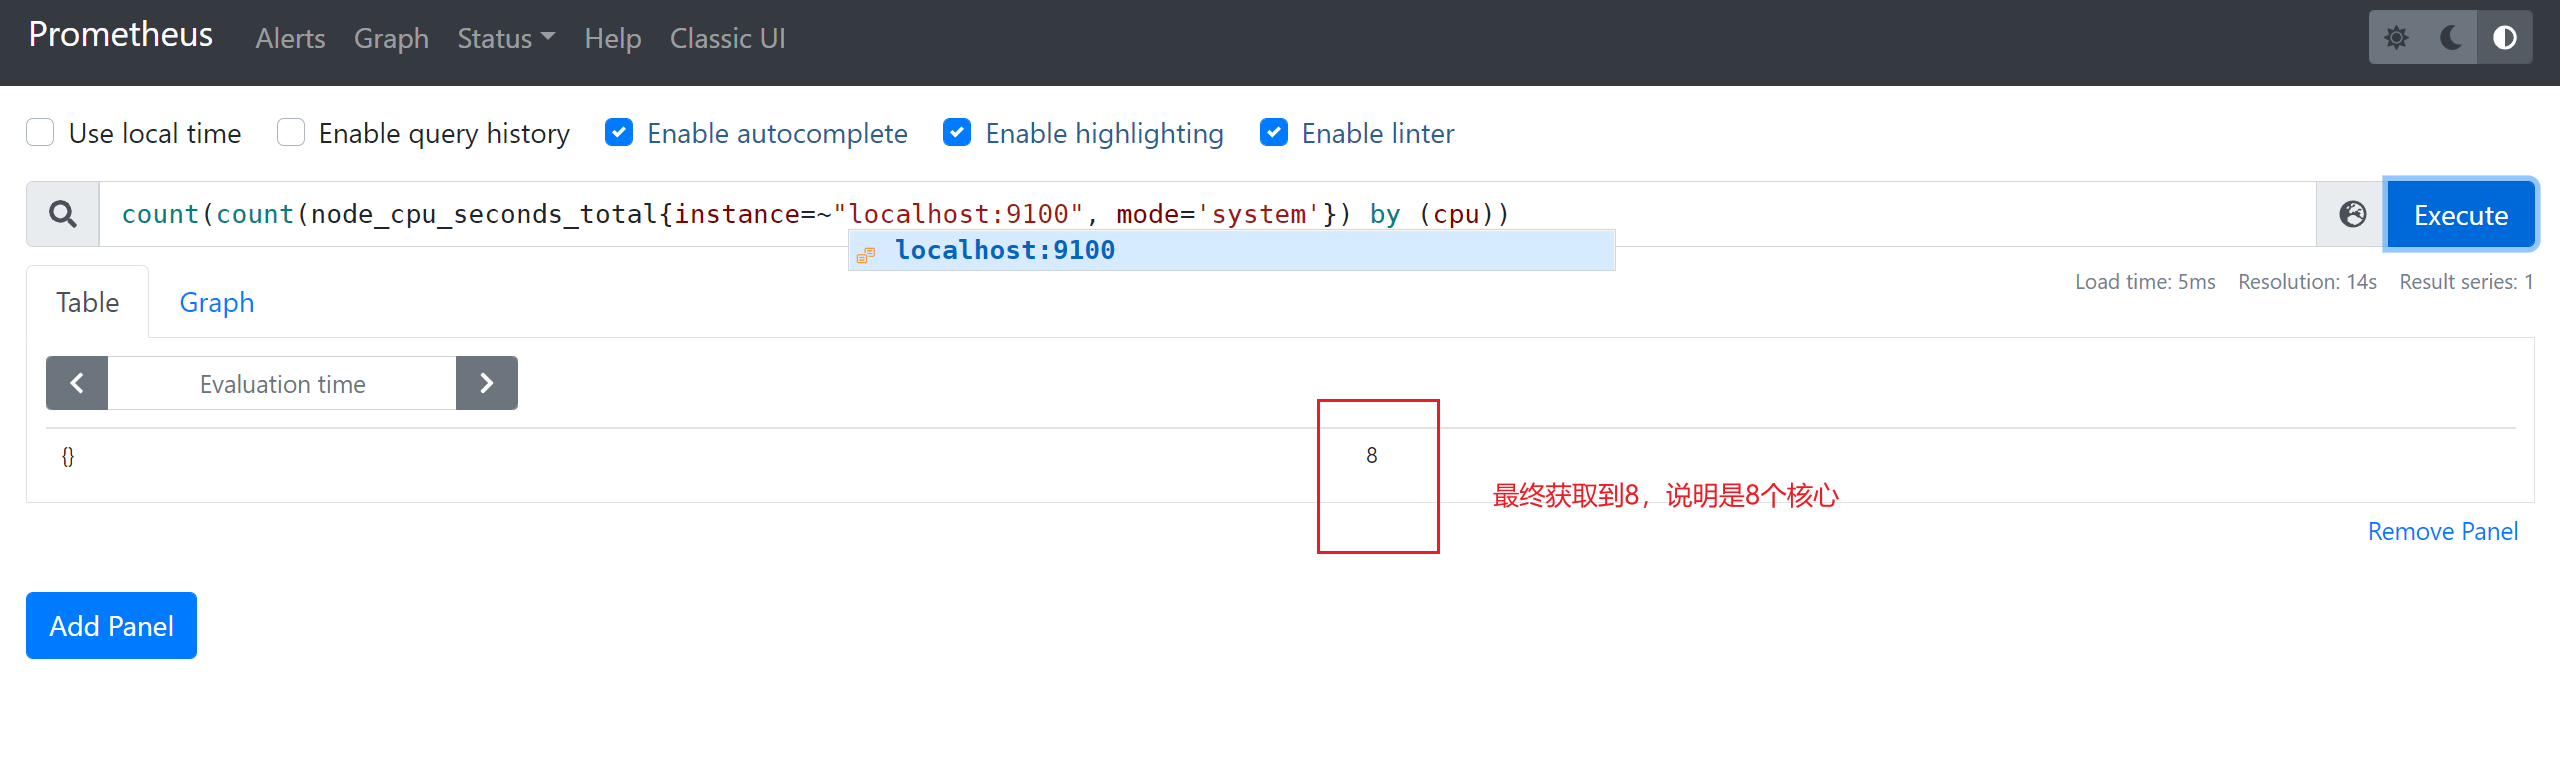
3.9 PQL的简单使用
3.9.1 获取当前的服务器的CPU的核心数
3.9.2 内存使用率
使用率 = 实际可用内存 / 总内存
node_memory_Buffers_bytes
可用内存
node_memory_MemAvailable_bytes
表达式:
((node_memory_MemTotal_bytes - node_memory_MemFree_bytes - node_memory_Buffers_bytes - node_memory_Cached_bytes) / (node_memory_MemTotal_bytes )) * 100
内存可用率:
(1-(node_memory_MemTotal_bytes - node_memory_MemFree_bytes - node_memory_Buffers_bytes - node_memory_Cached_bytes) / (node_memory_MemTotal_bytes )) * 100
3.9.3 硬盘io使用情况
表达式:
((rate(node_disk_read_bytes_total[1m] )+ rate(node_disk_written_bytes_total[1m])) / 1024 /1024) > 0
硬盘使⽤率 是 read + written 读和写 都会占用IO, /1024 两次后 就由 bytes => Mbs
3.9.4 硬盘使用情况
node_filesystem_size_bytes
(总大小-剩余大小)/总大小=硬盘使用率
表达式:
(node_filesystem_size_bytes {mountpoint ="/"} - node_filesystem_free_bytes {mountpoint ="/"}) /
node_filesystem_size_bytes {mountpoint ="/"} * 100
3.9.5 网卡流量
node_network_transmit_bytes_total
表达式:
irate(node_network_transmit_bytes_total{device!~"lo"}[1m]) / 1000
irate和rate都会用于计算某个指标在一定时间间隔内的变化速率。但是它们的计算方法有所不同:irate取的是在指定时间范围内的最近两个数据点来算速率,而rate会取指定时间范围内所有数据点,算出一组速率,然后取平均值作为结果
3.9.6 监控cpu
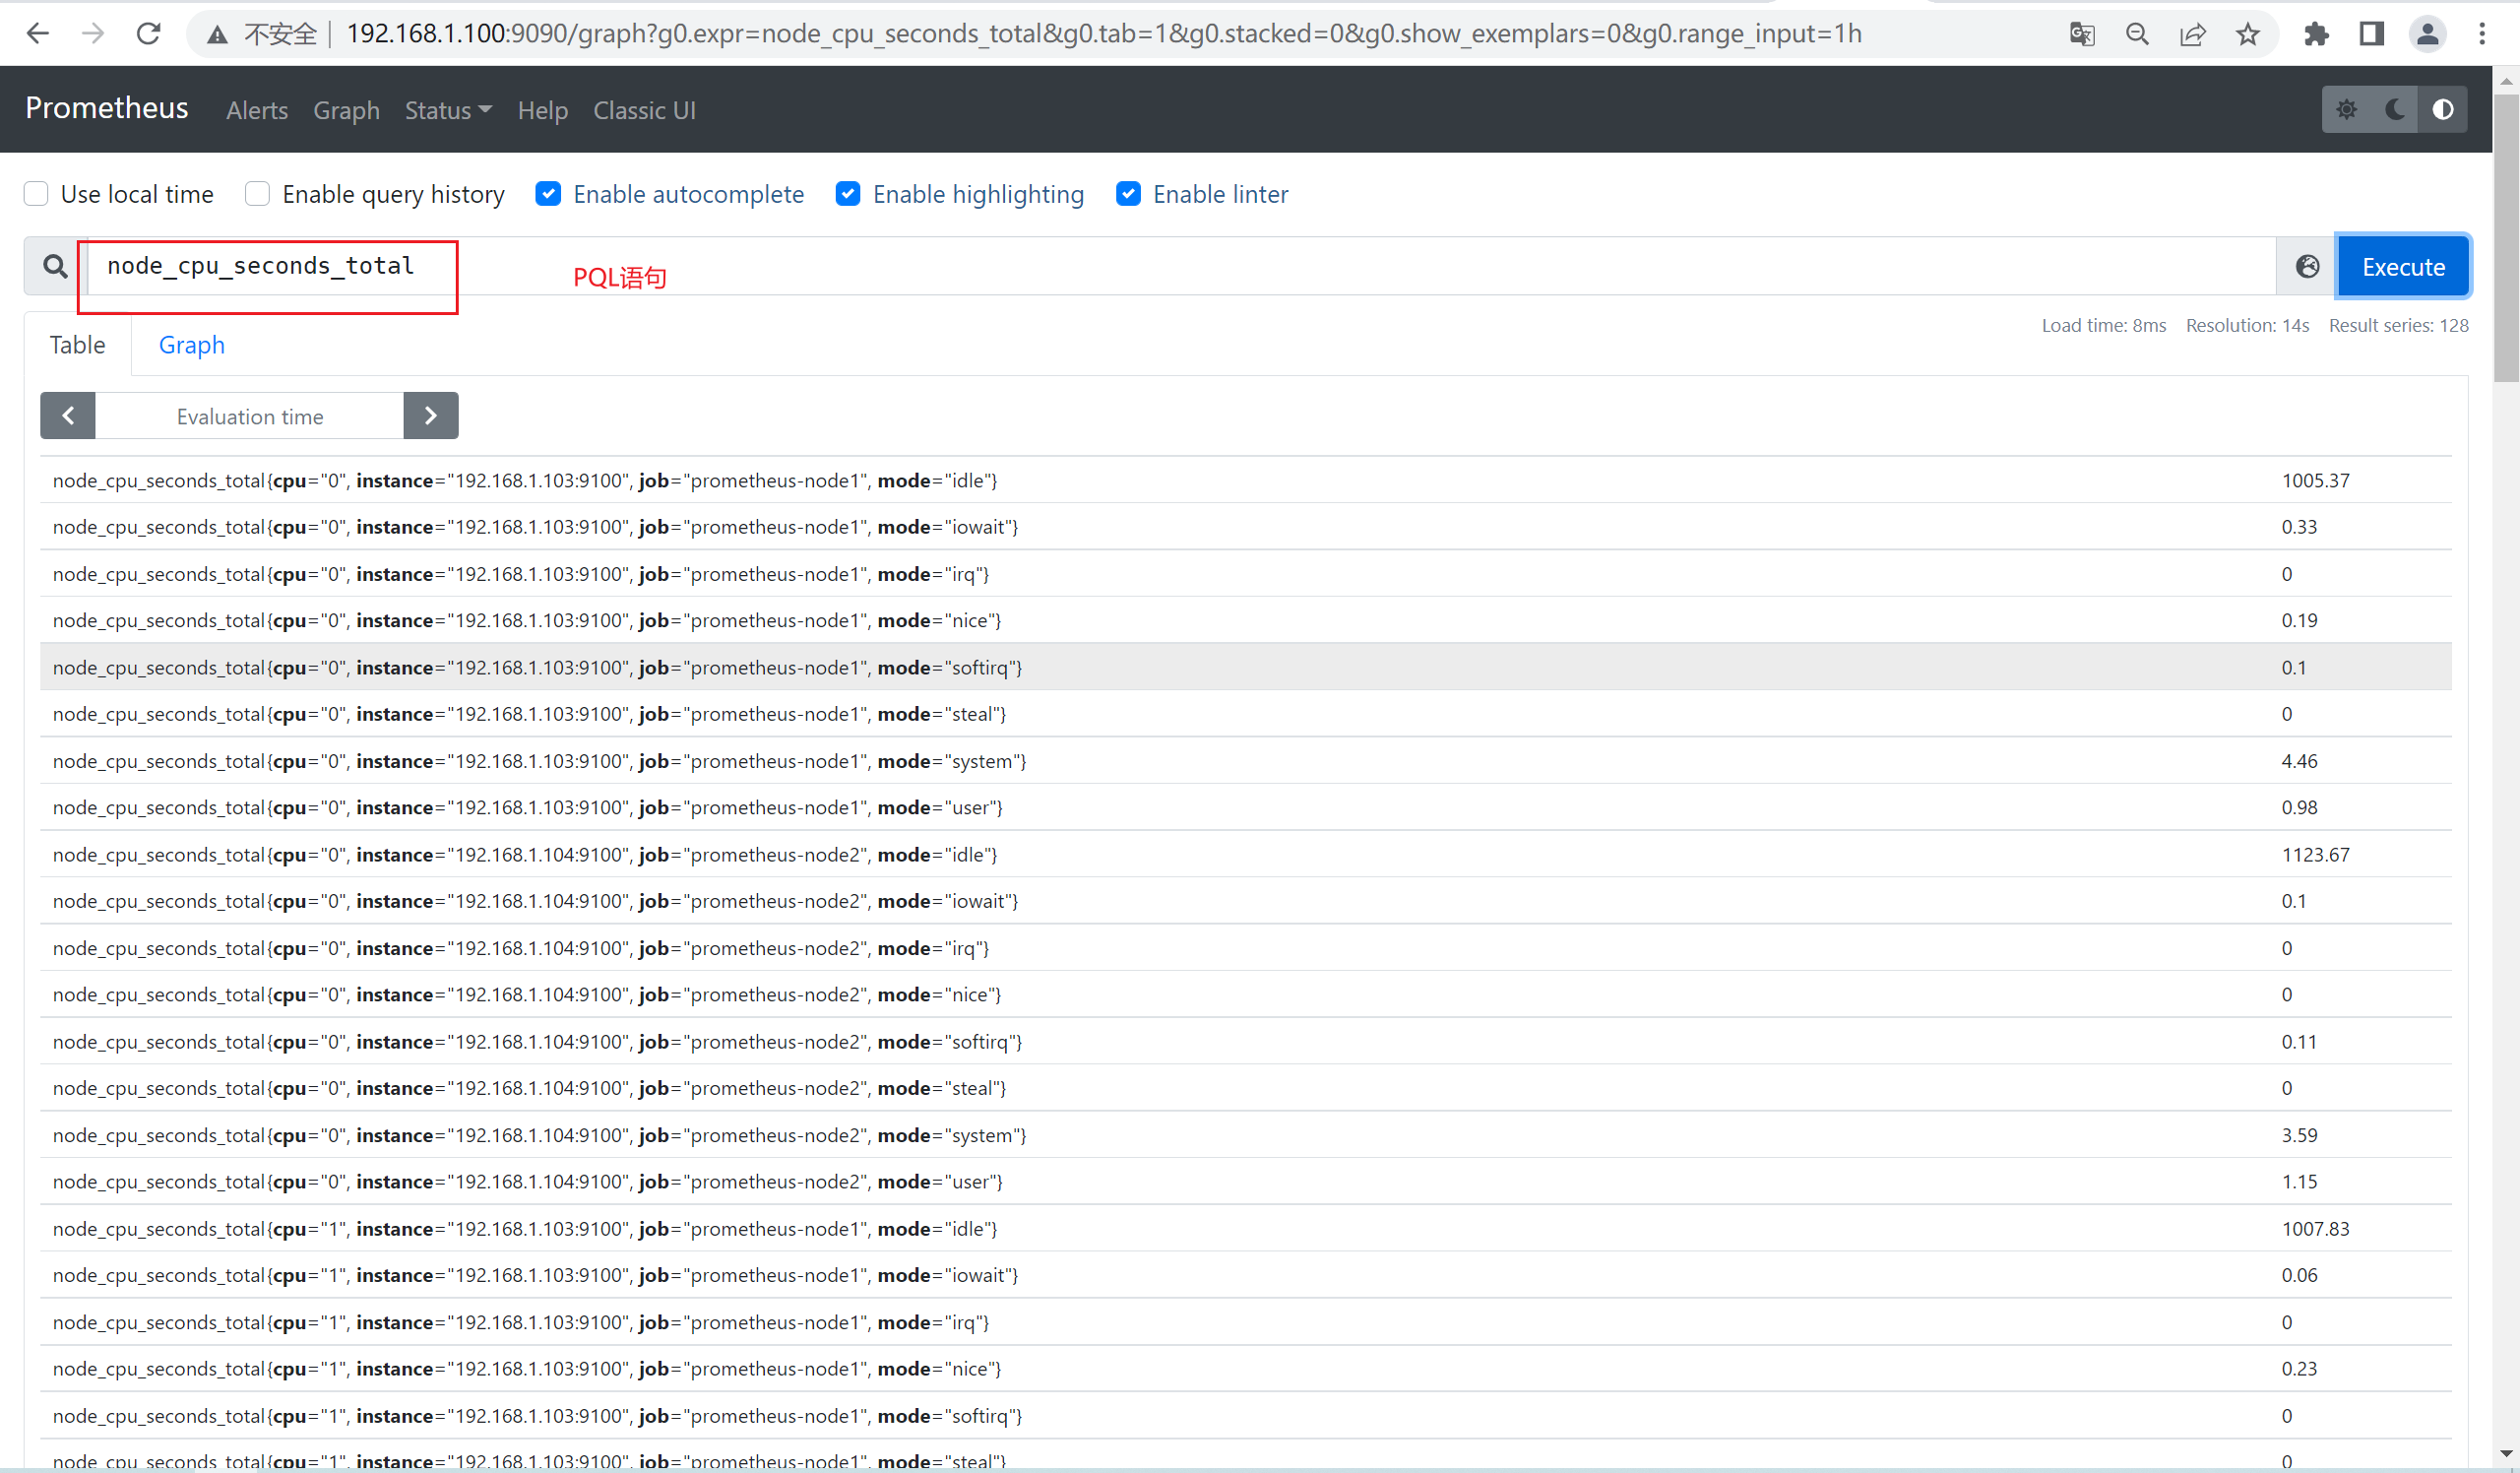
● node_cpu_seconds_total
cpu情况
查看cpu使用空闲情况
(1-((sum(increase(node_cpu_seconds_total{mode="idle"}[1m])) by (instance))/(sum(increase(node_cpu_seconds_total[1m])) by (instance)))) * 100
3.10 配置告警
grafana本身也具有告警的功能,我们先看看在grafana上如何配置告警
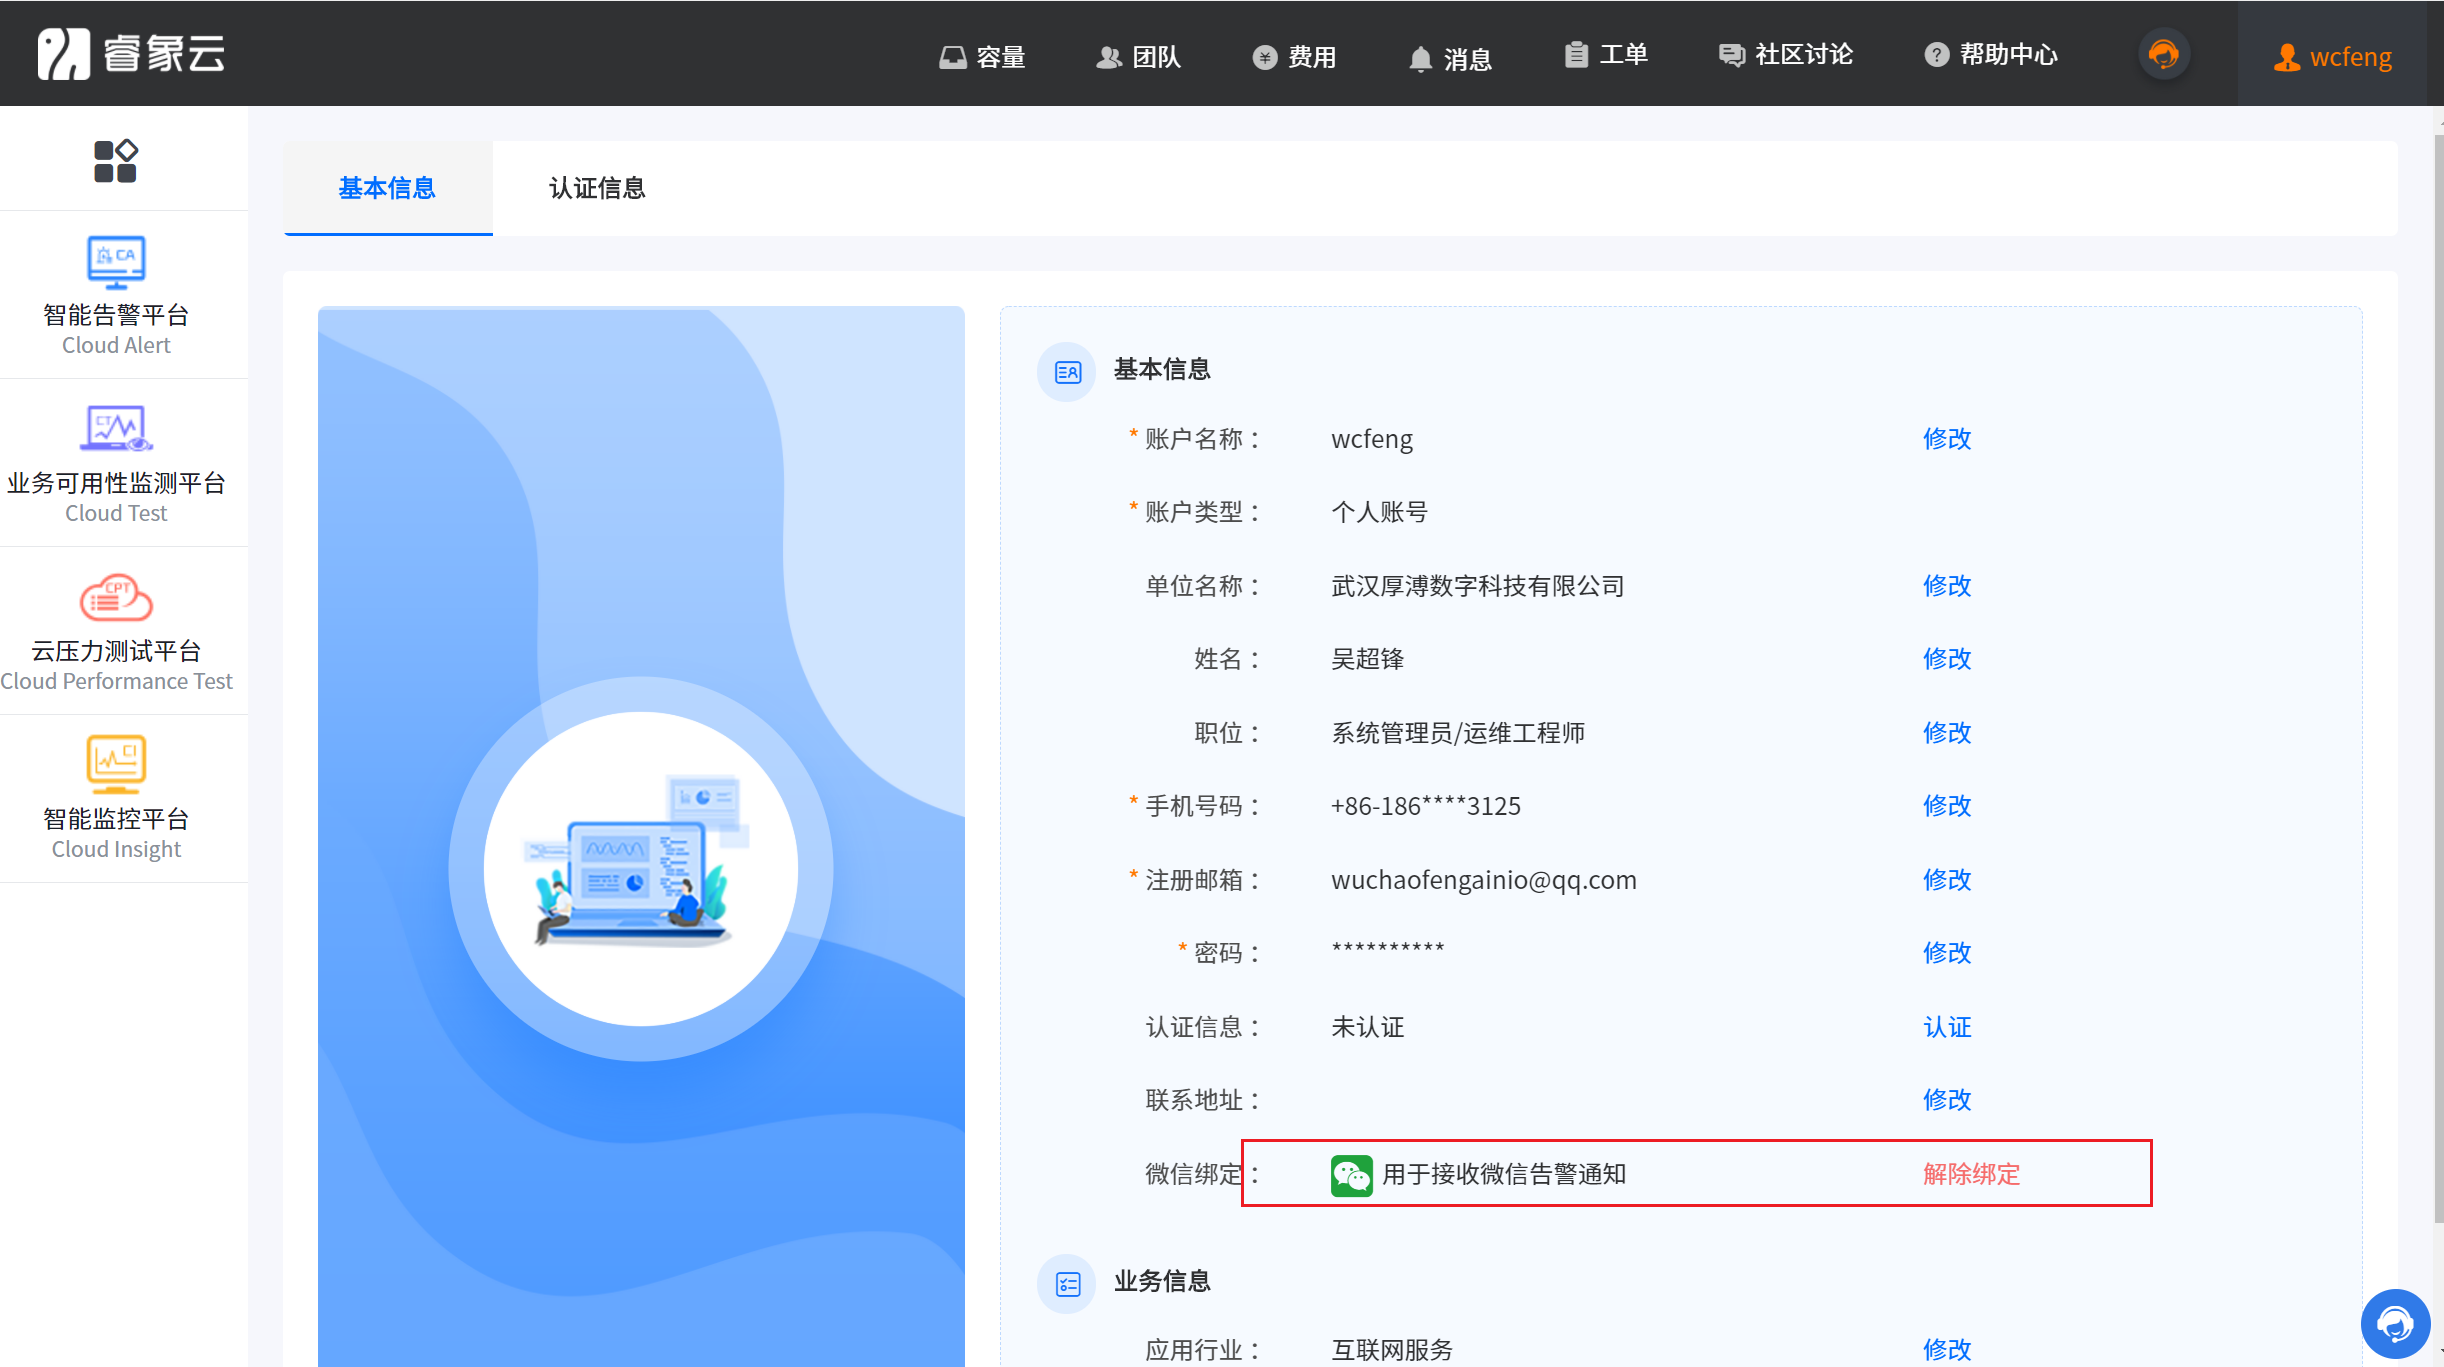
我们使用了第三方的睿象云结合grafana来实现的告警
3.10.1 注册睿象云账号
集成睿象云之前须在其官网进行注册并登录,注册时需填入个人手机号和电子邮箱,以下是其官方网站 https://www.aiops.com。登录之后会看到如下界面。
点击智能告警平台

点击集成
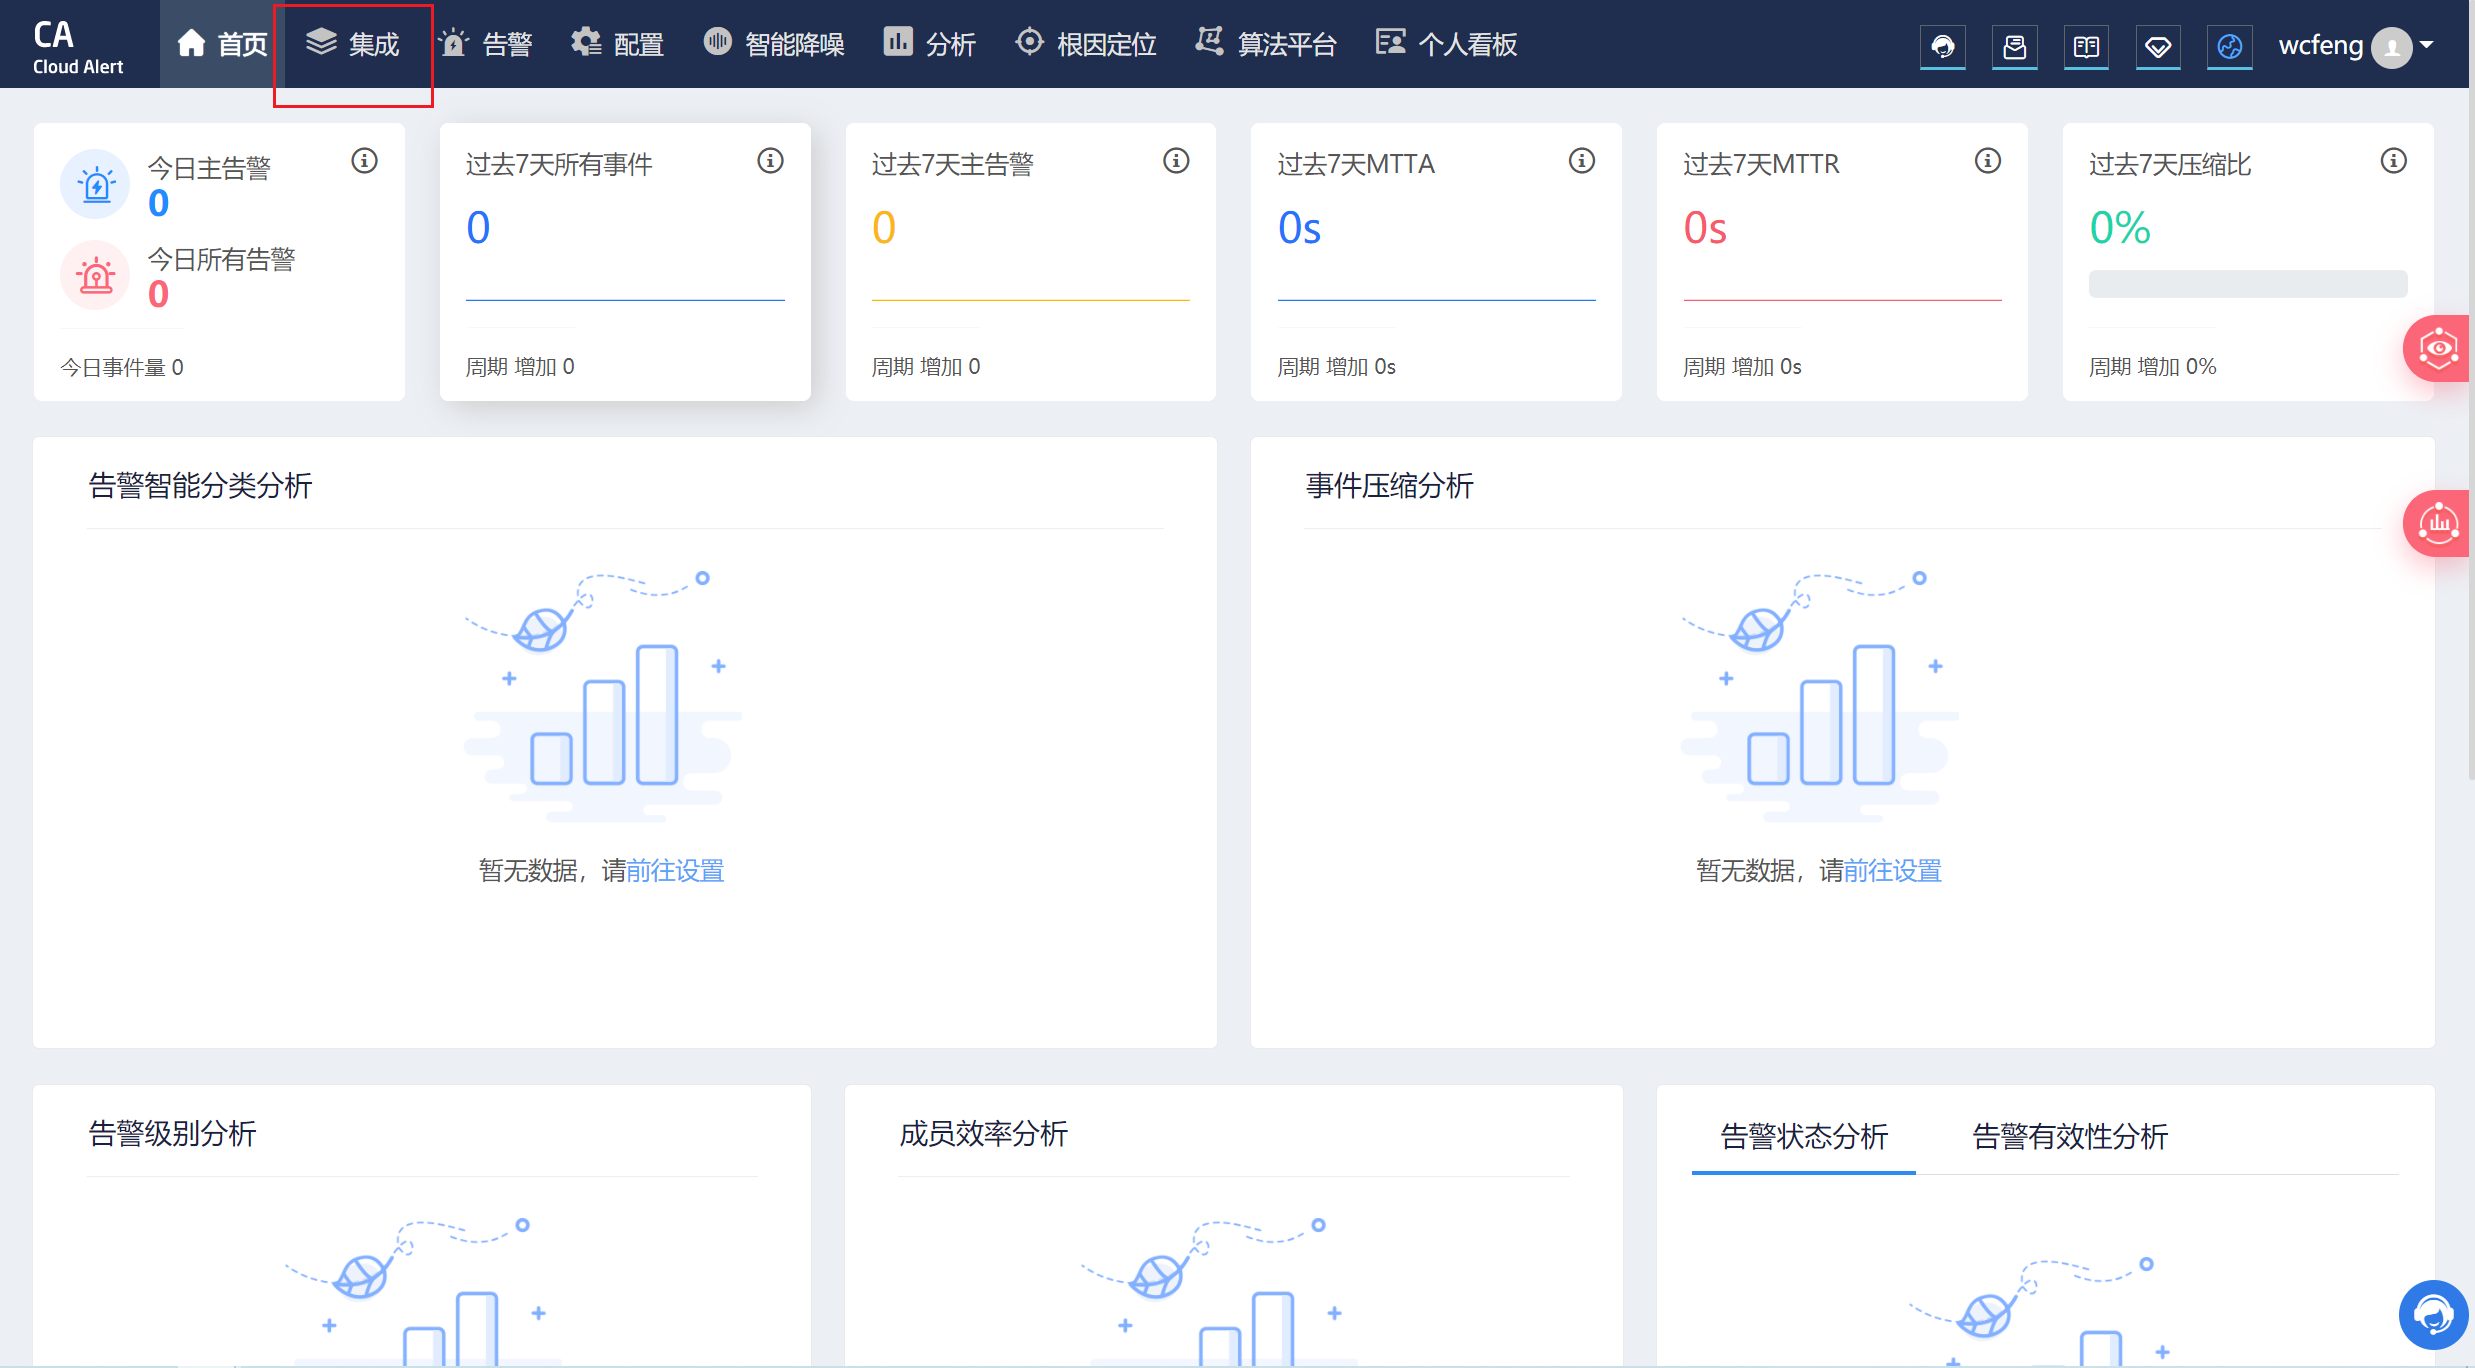
点击Grafana
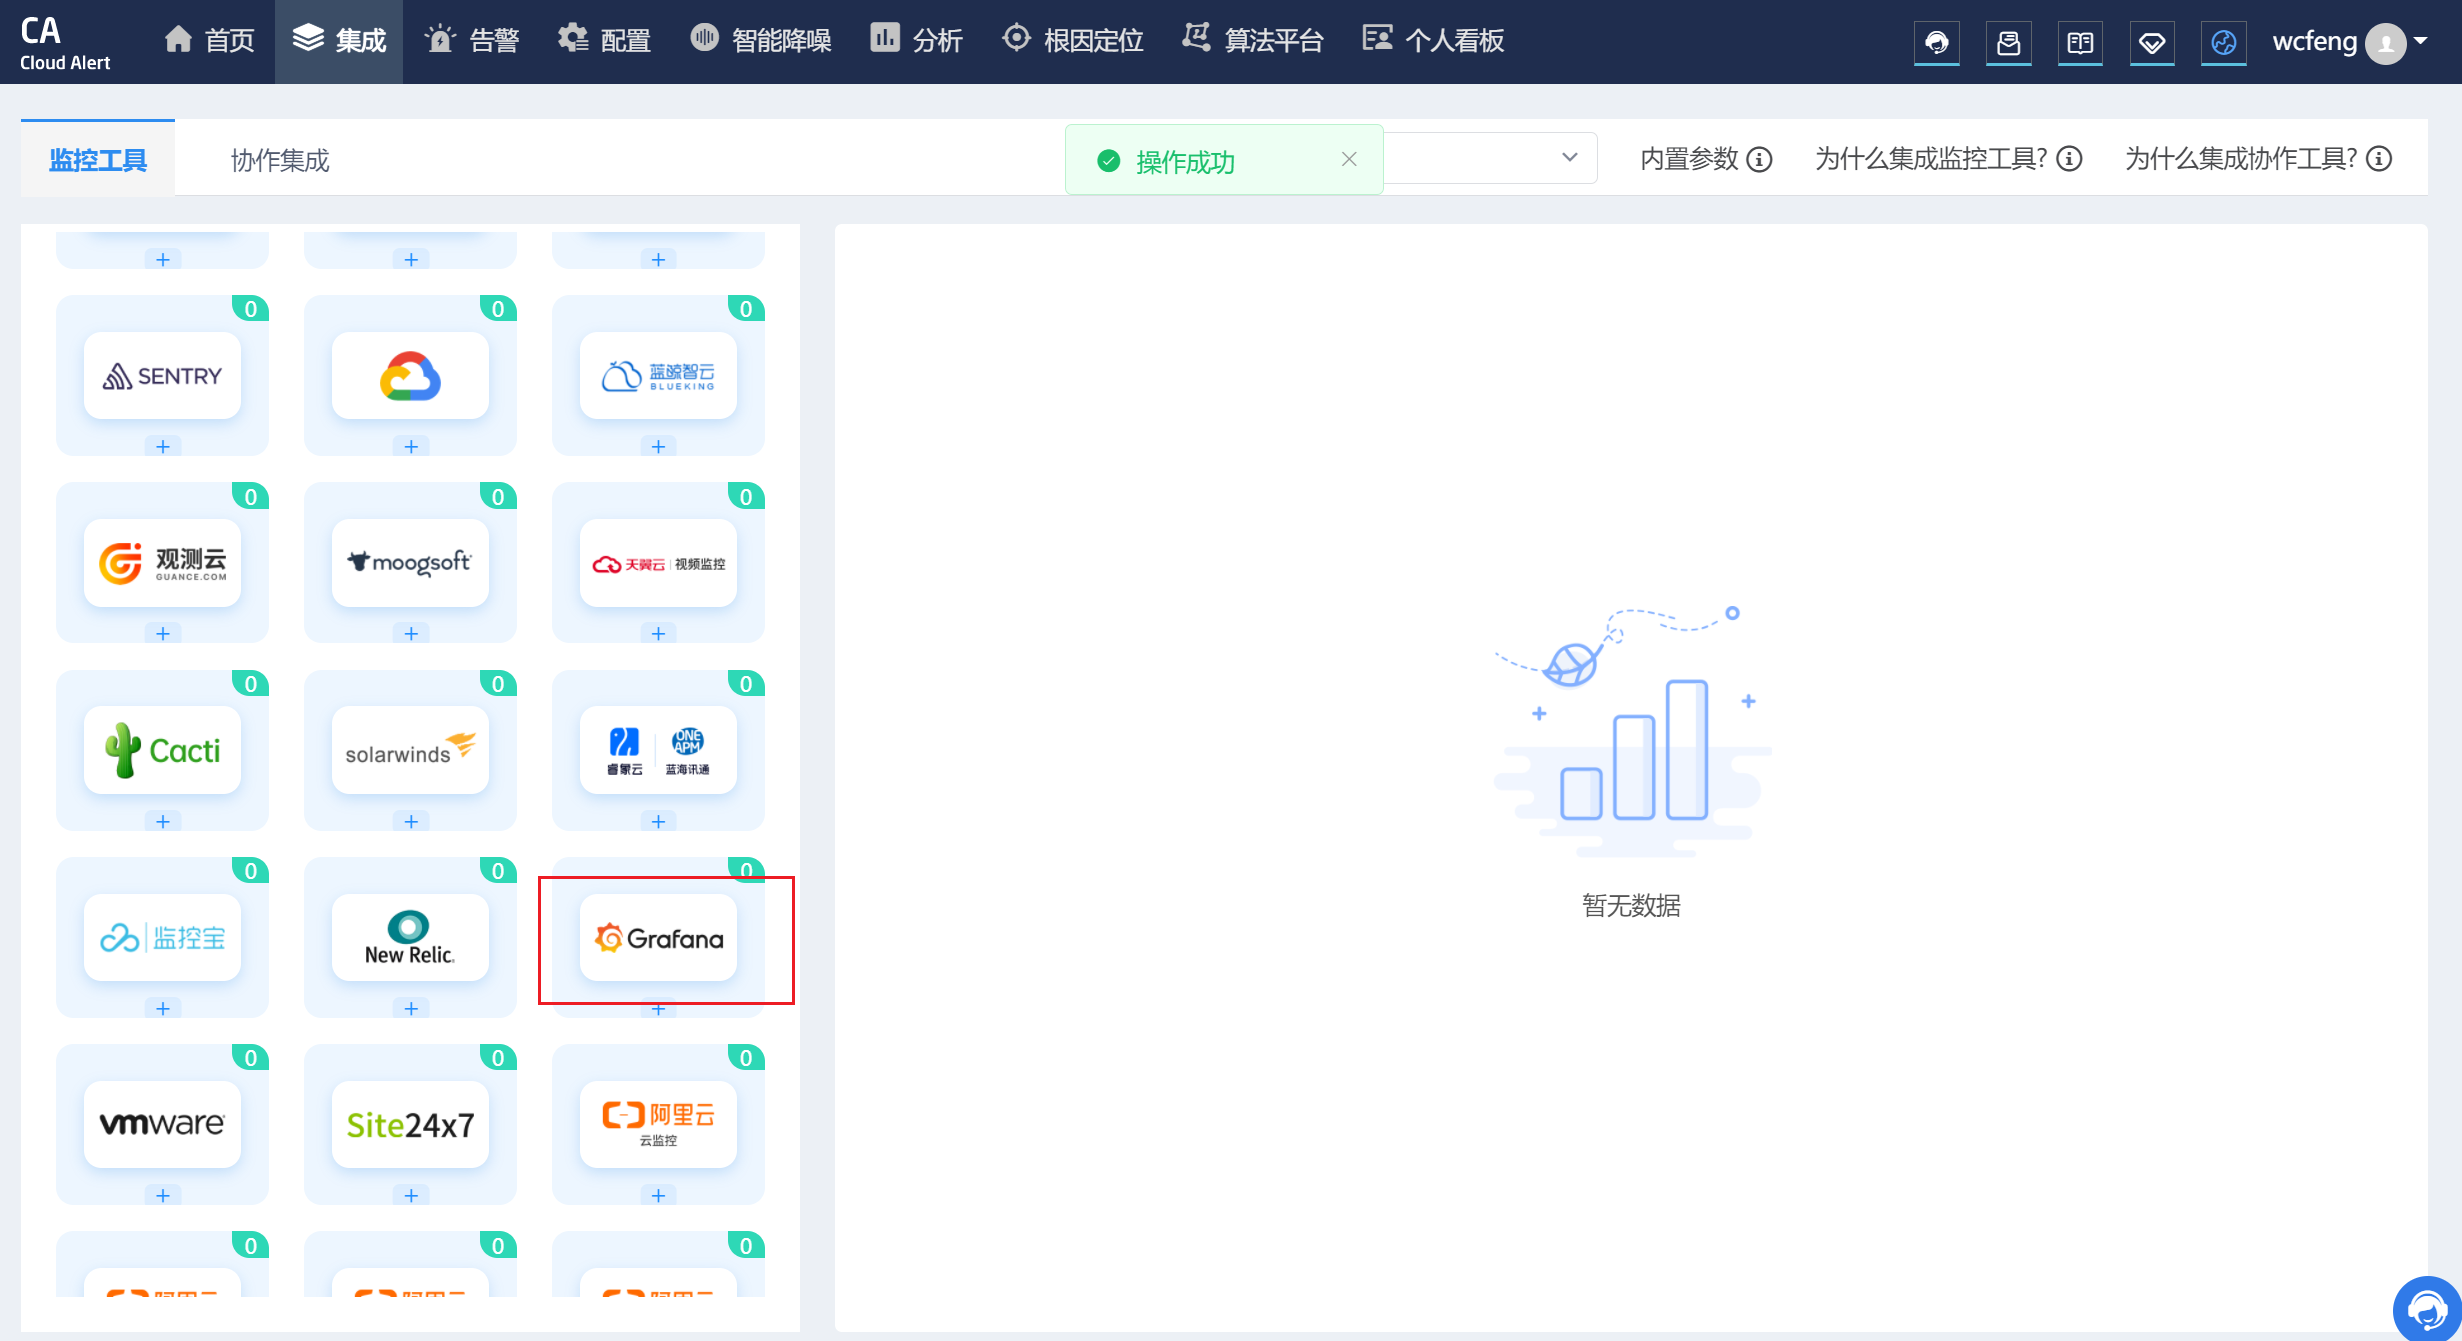
配置Grafana信息
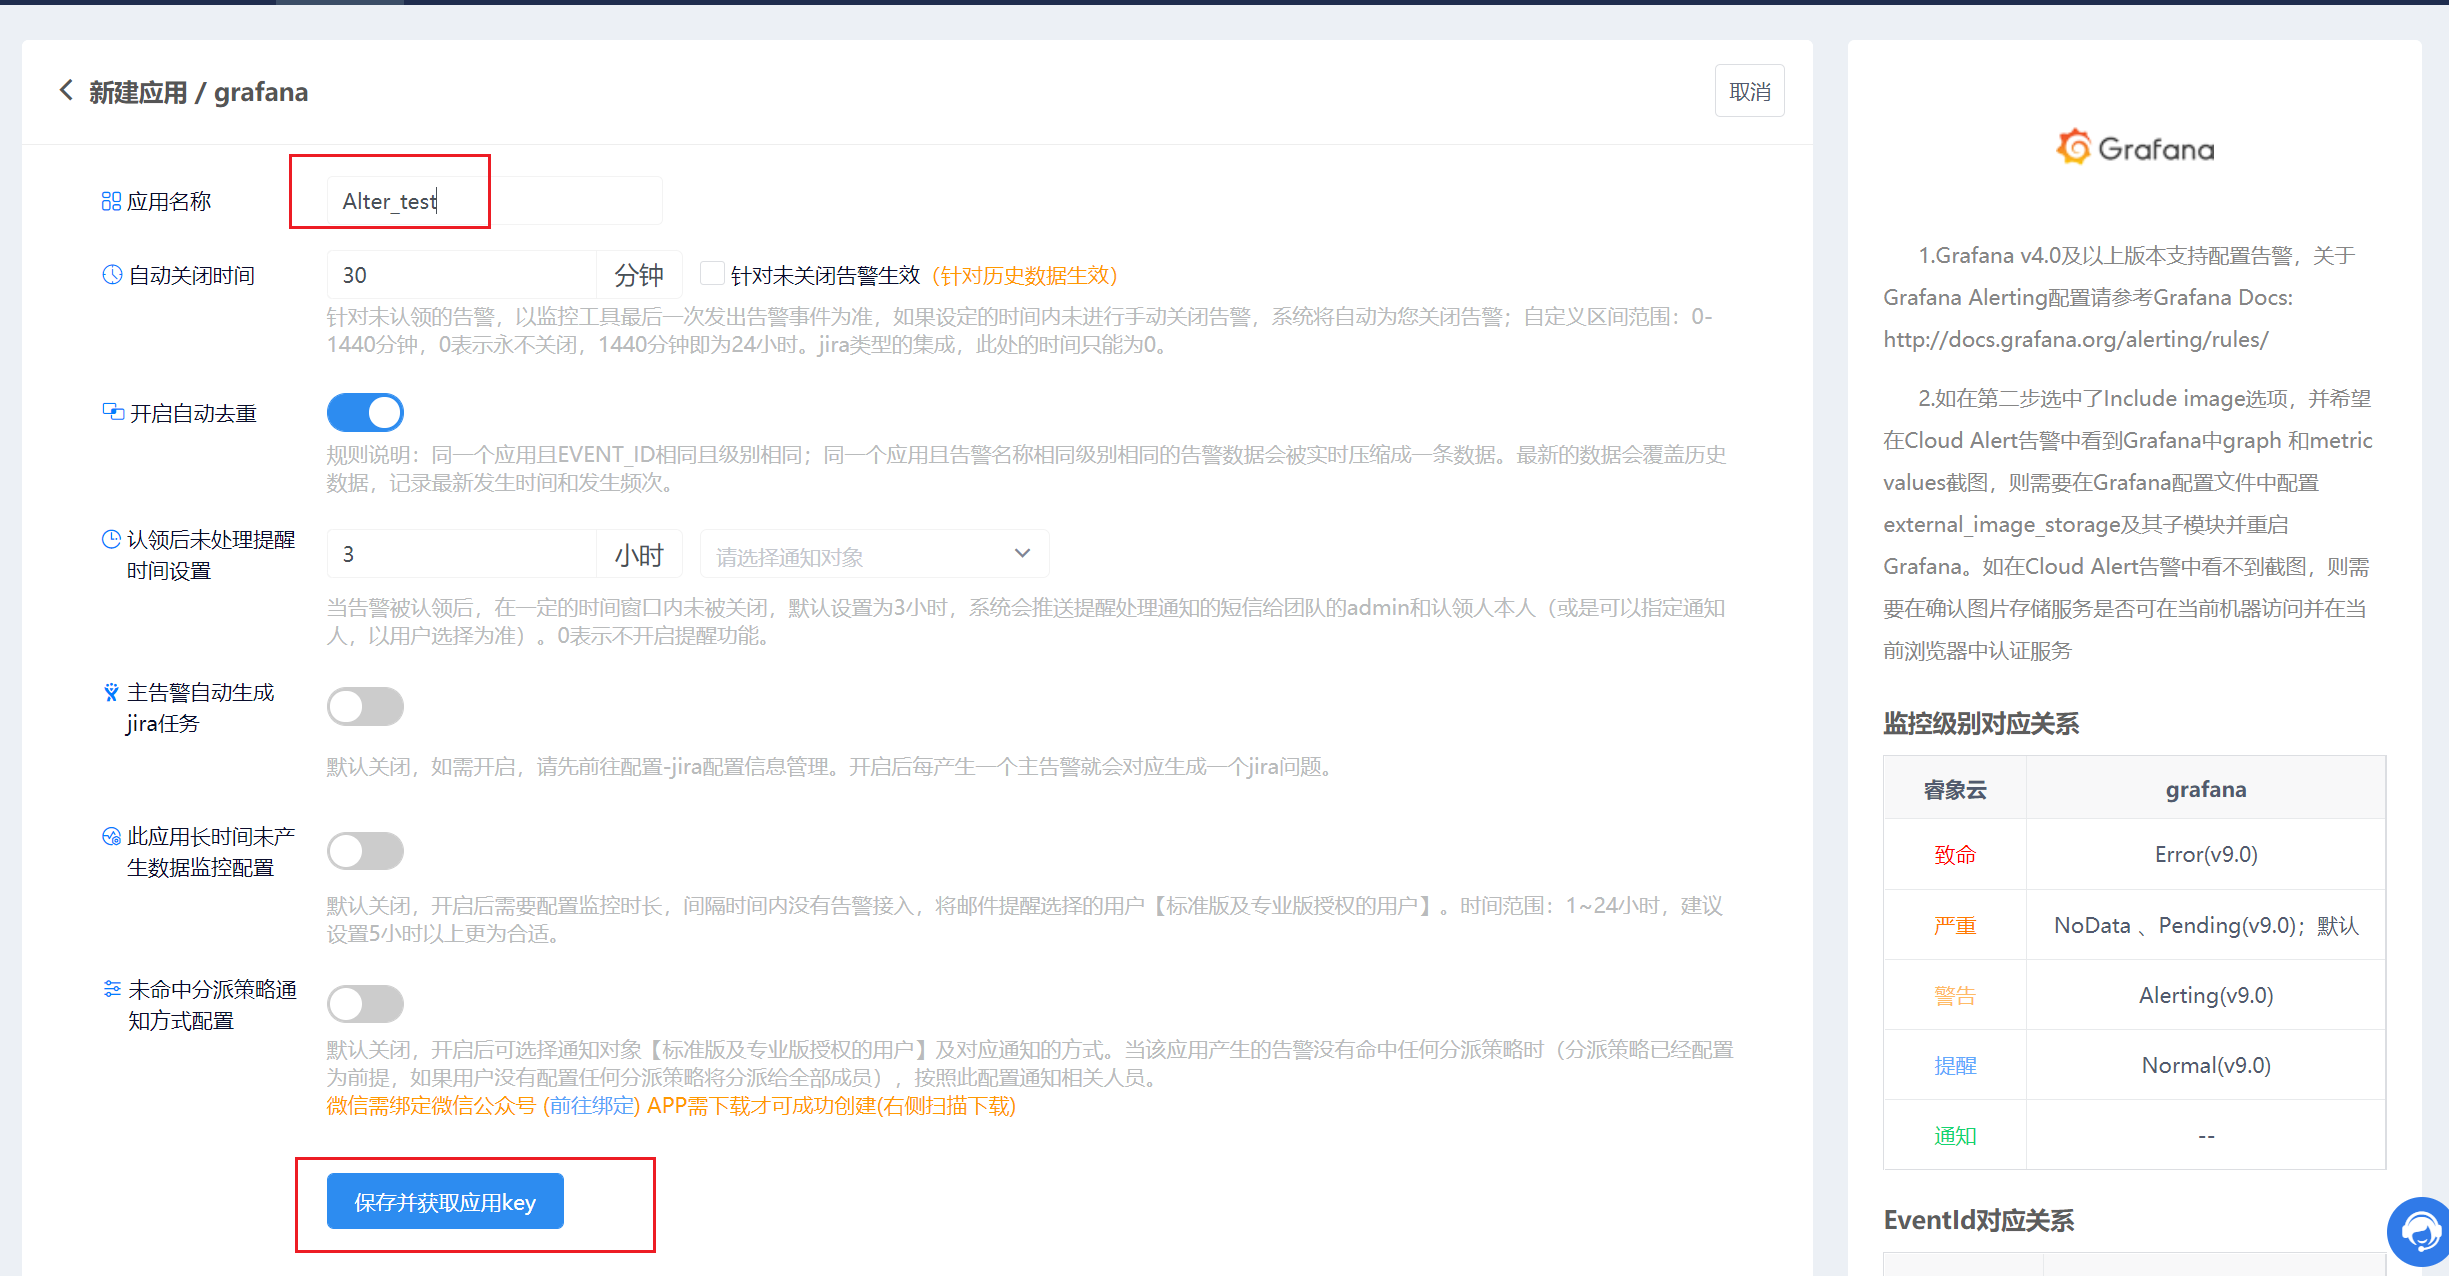
得到 AppKey 之后,配置 Grafana
http://api.aiops.com/alert/api/event/grafana/v1/08915764499d480c8d58d002c66694e5/
3.10.2 配置告警通知策略
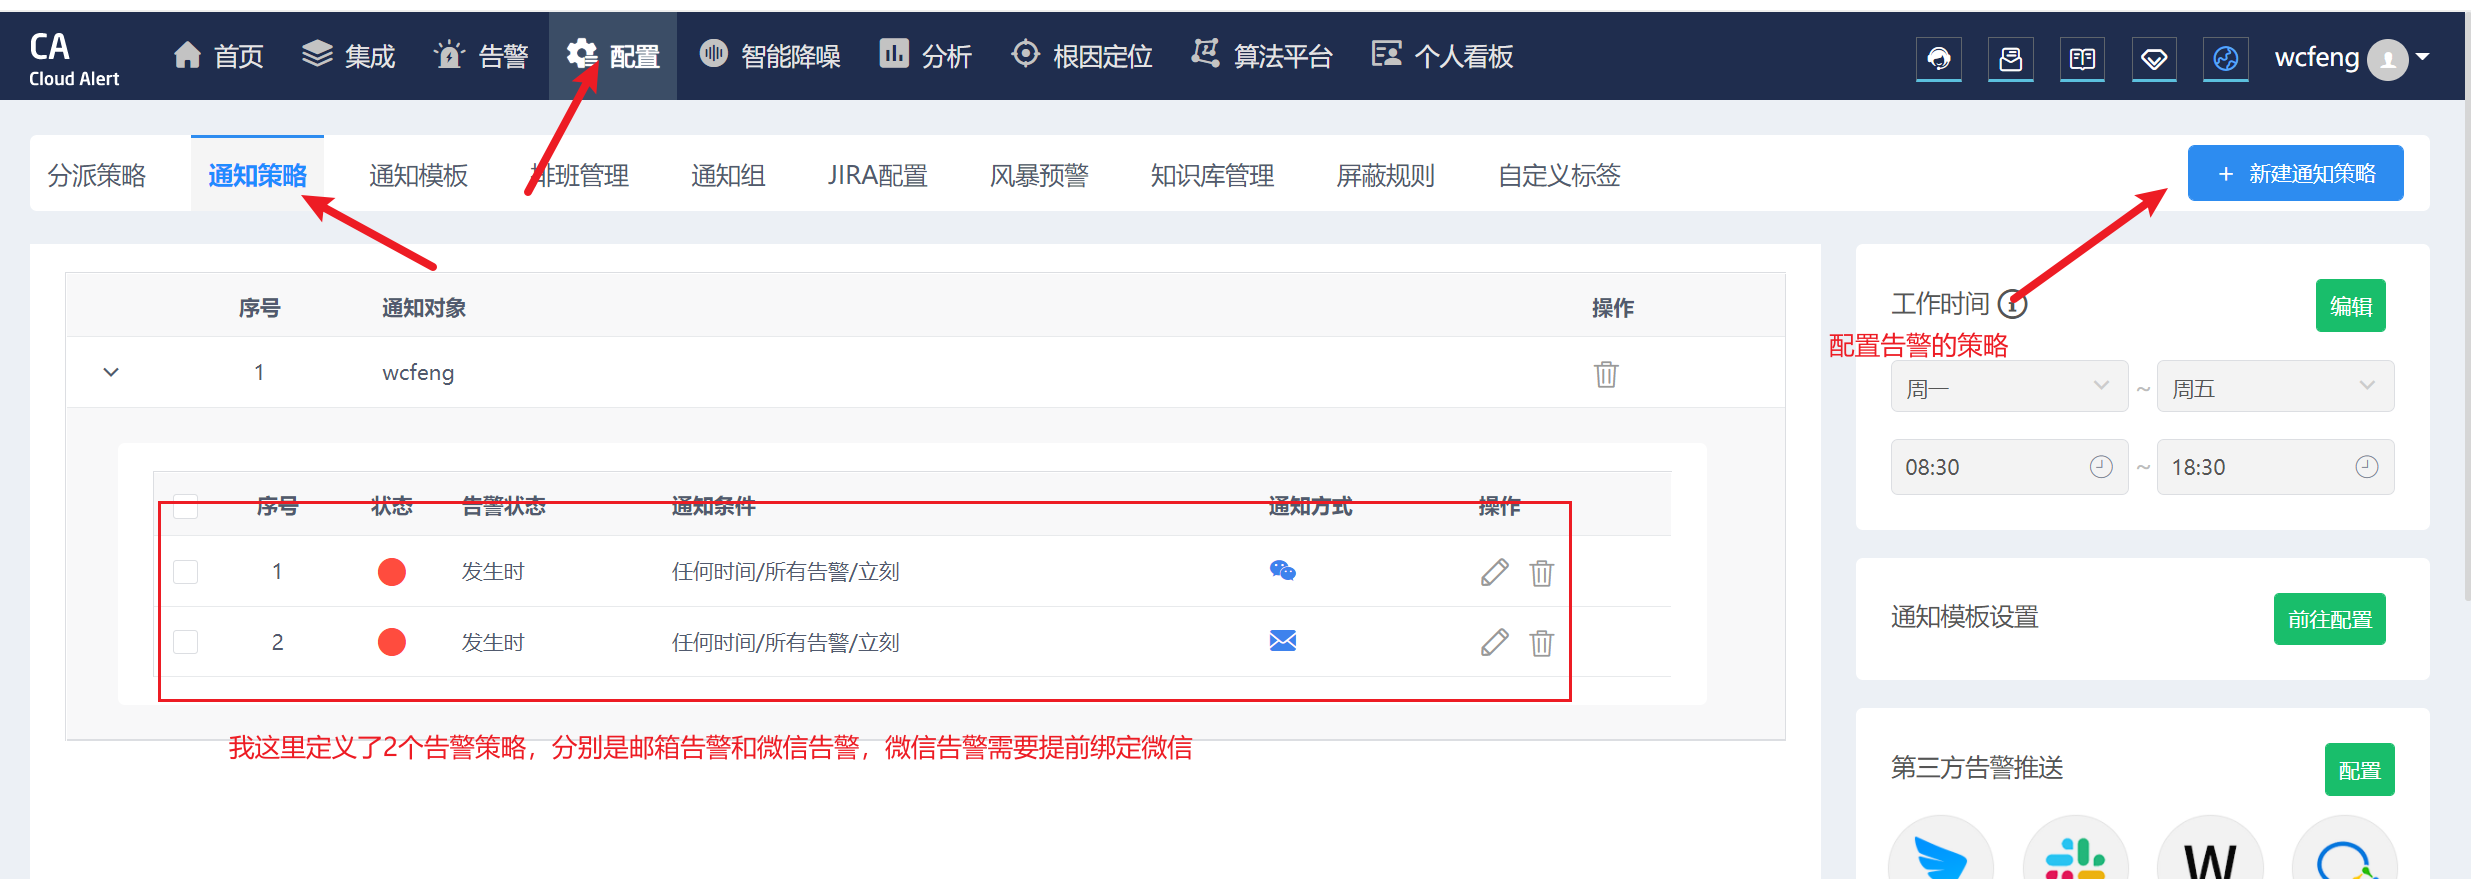
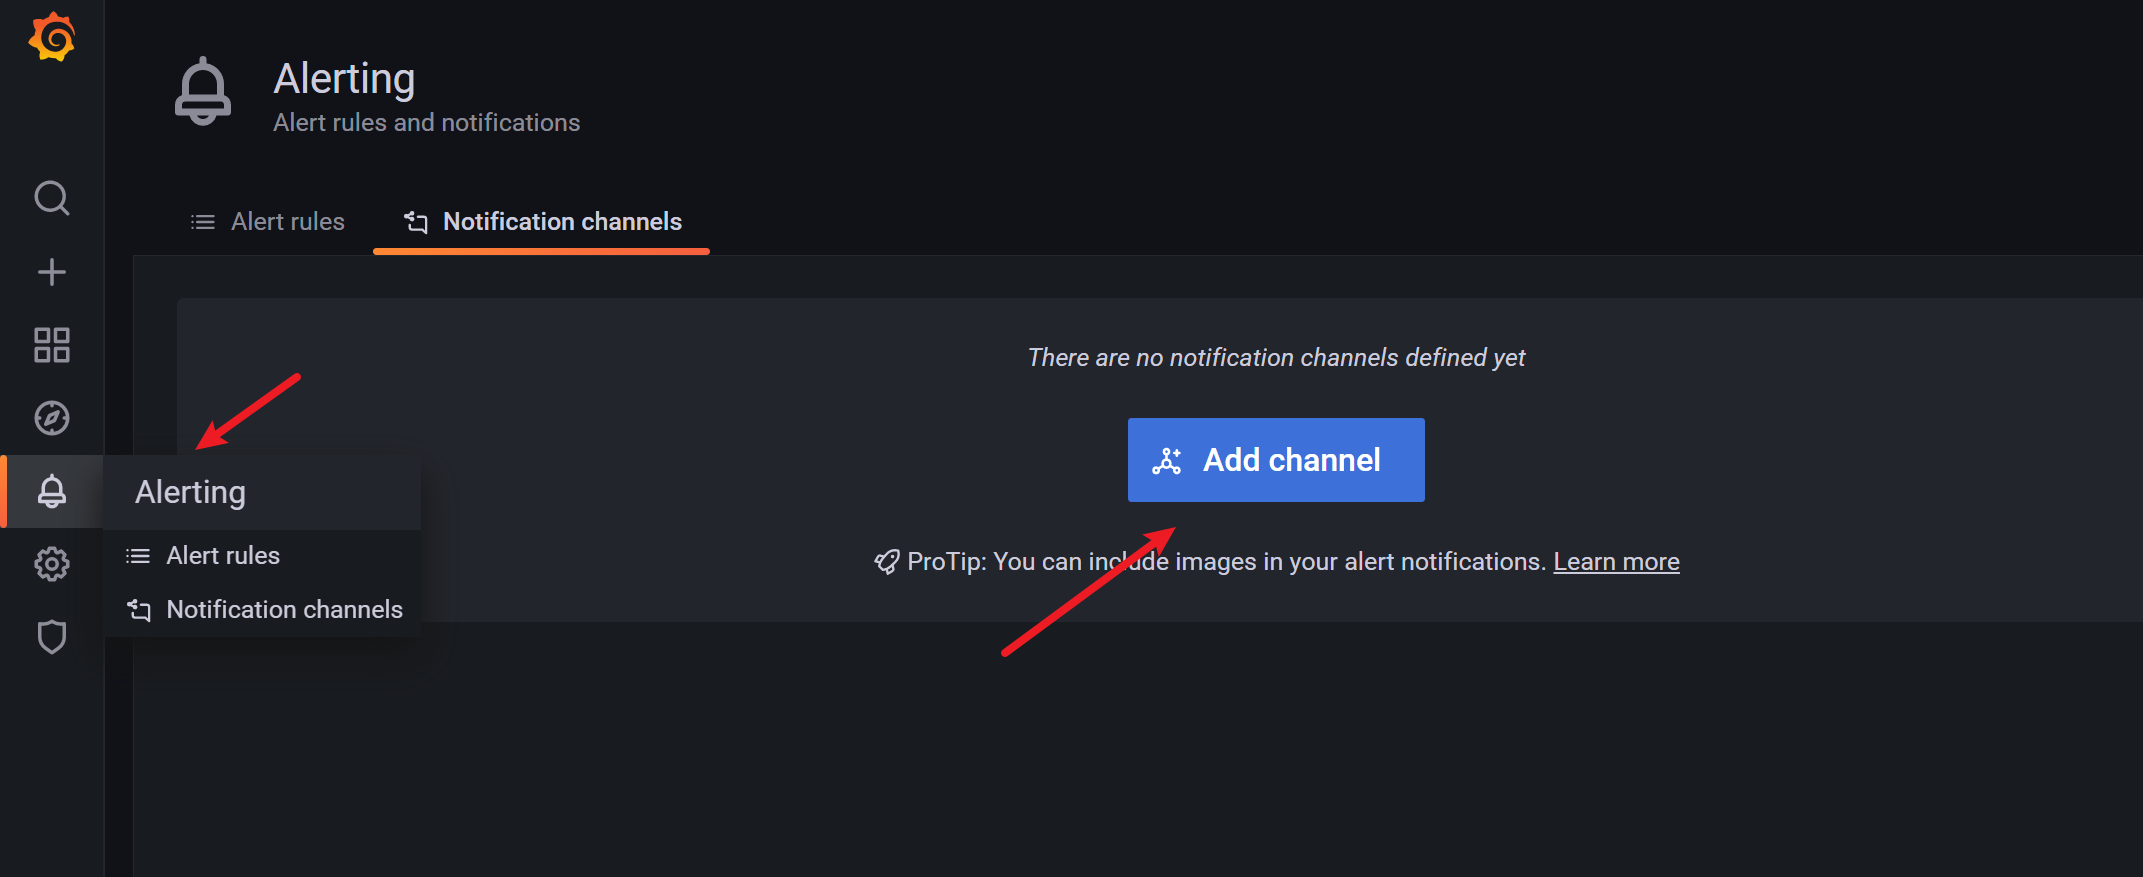
3.10.3 在 Grafana 中创建 Notification channel
配置步骤
一、在Grafana中配置Webhook URL
1、在Grafana中创建Notification channel,选择类型为Webhook;
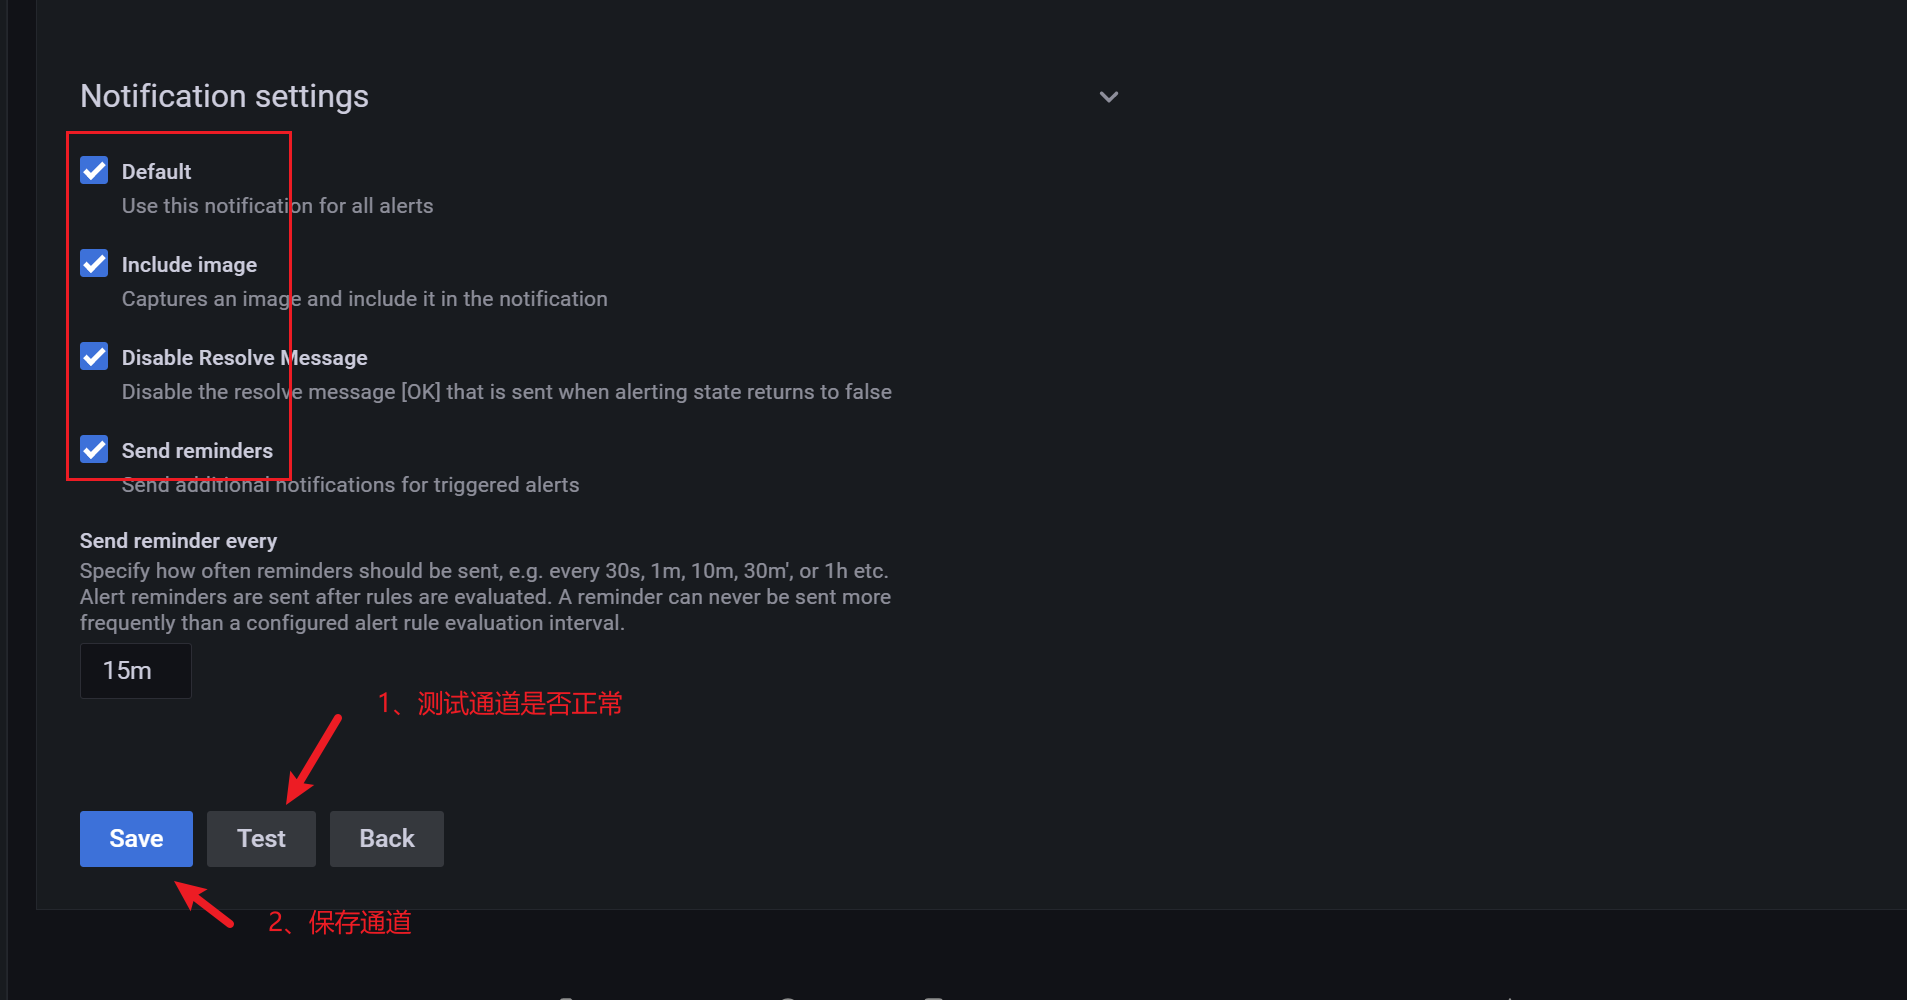
2、推荐选中Send on all alerts和Include image,Cloud Alert体验更佳;
3、将第一步中生成的Webhook URL填入Webhook settings Url;
URL格式:
http://api.aiops.com/alert/api/event/grafana/v1/08915764499d480c8d58d002c66694e5/ (保存当前应用,即可获取完整webhook地址信息)
4、Http Method选择POST;
5、Send Test&Save
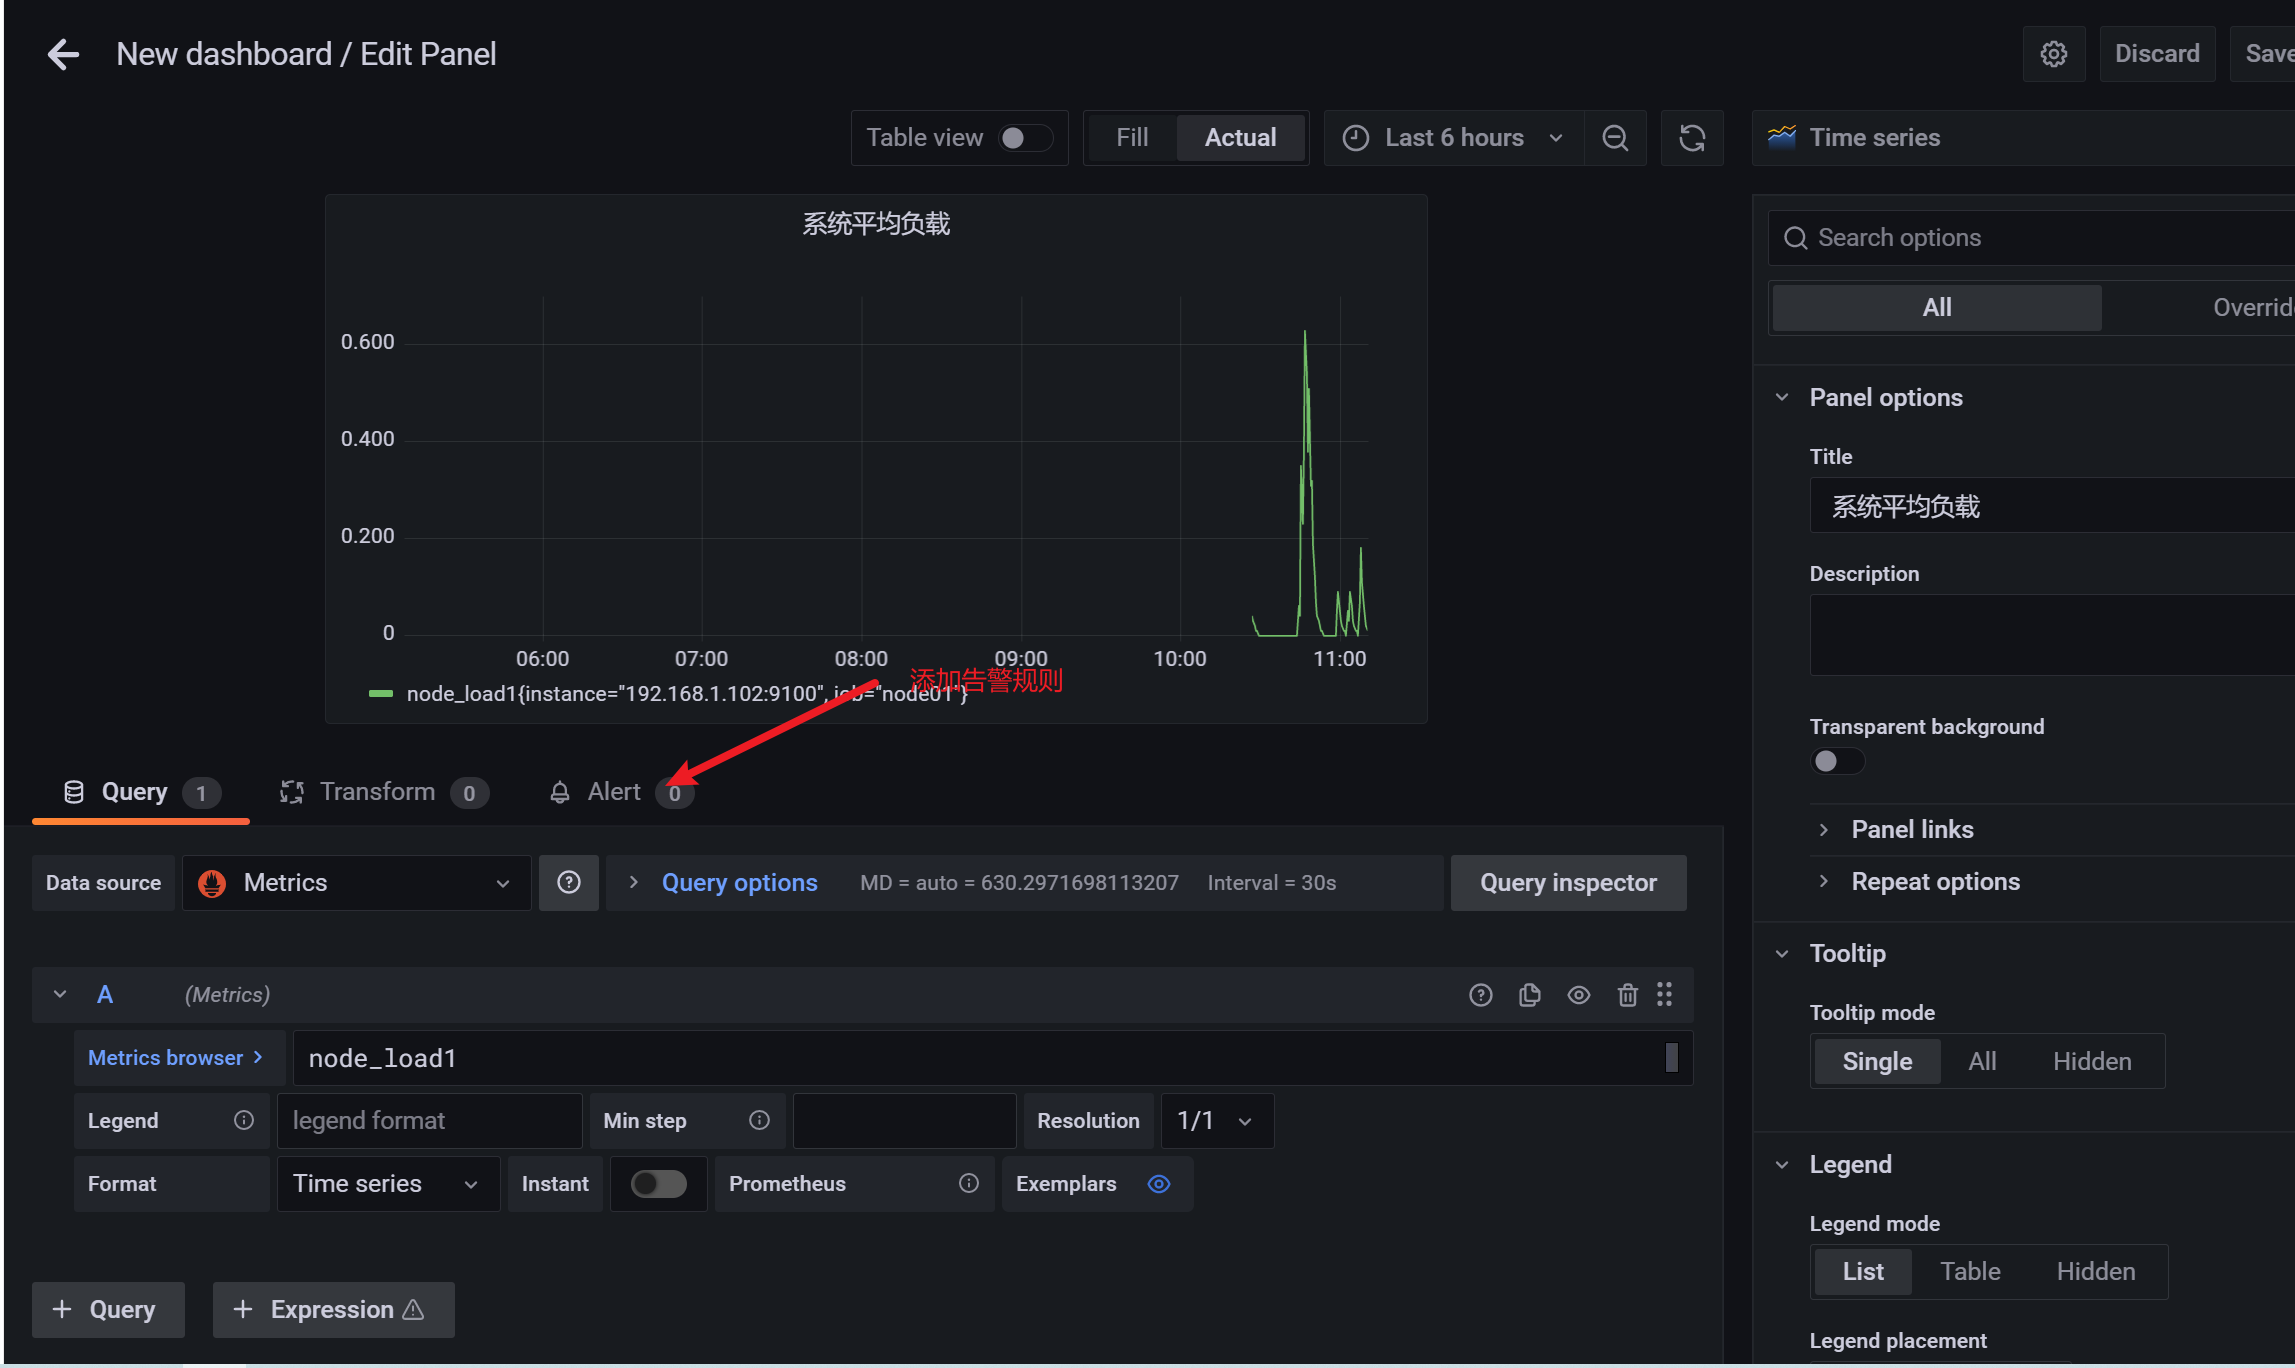
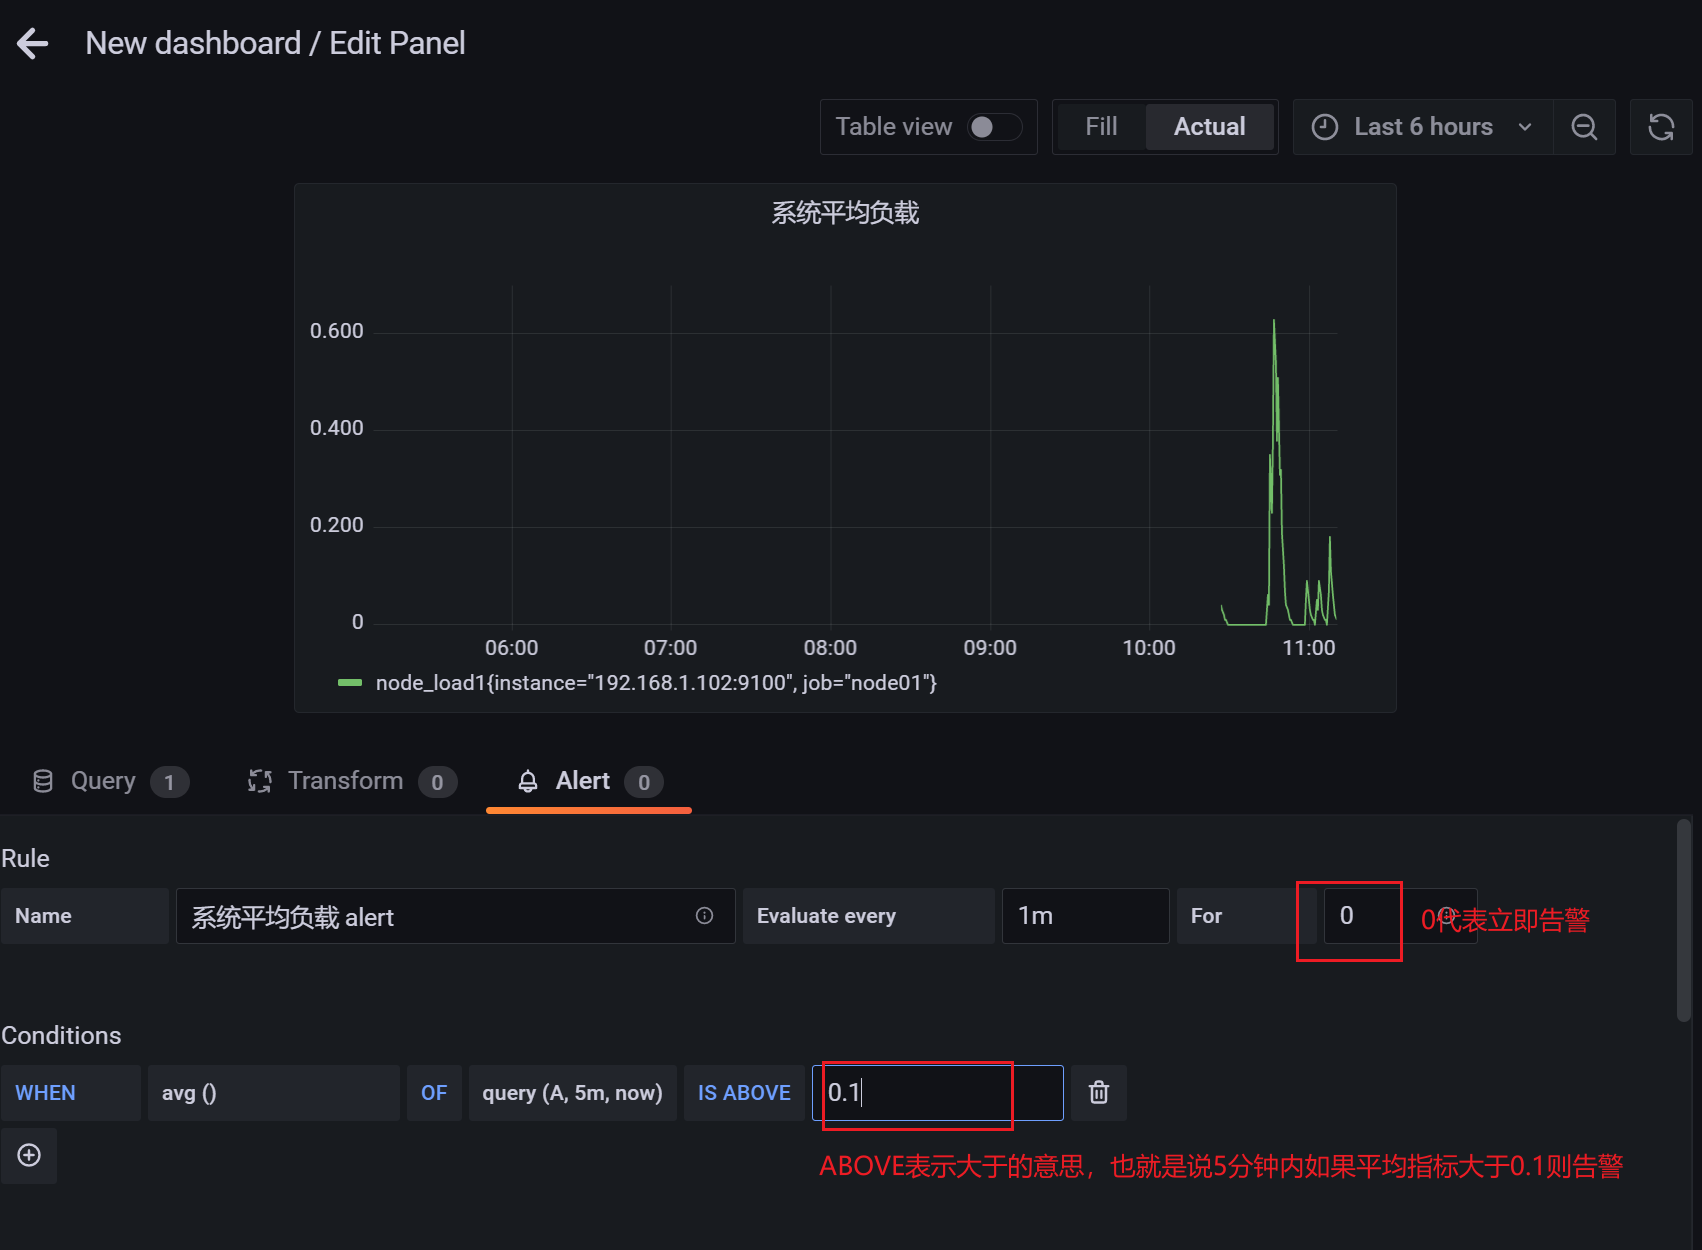
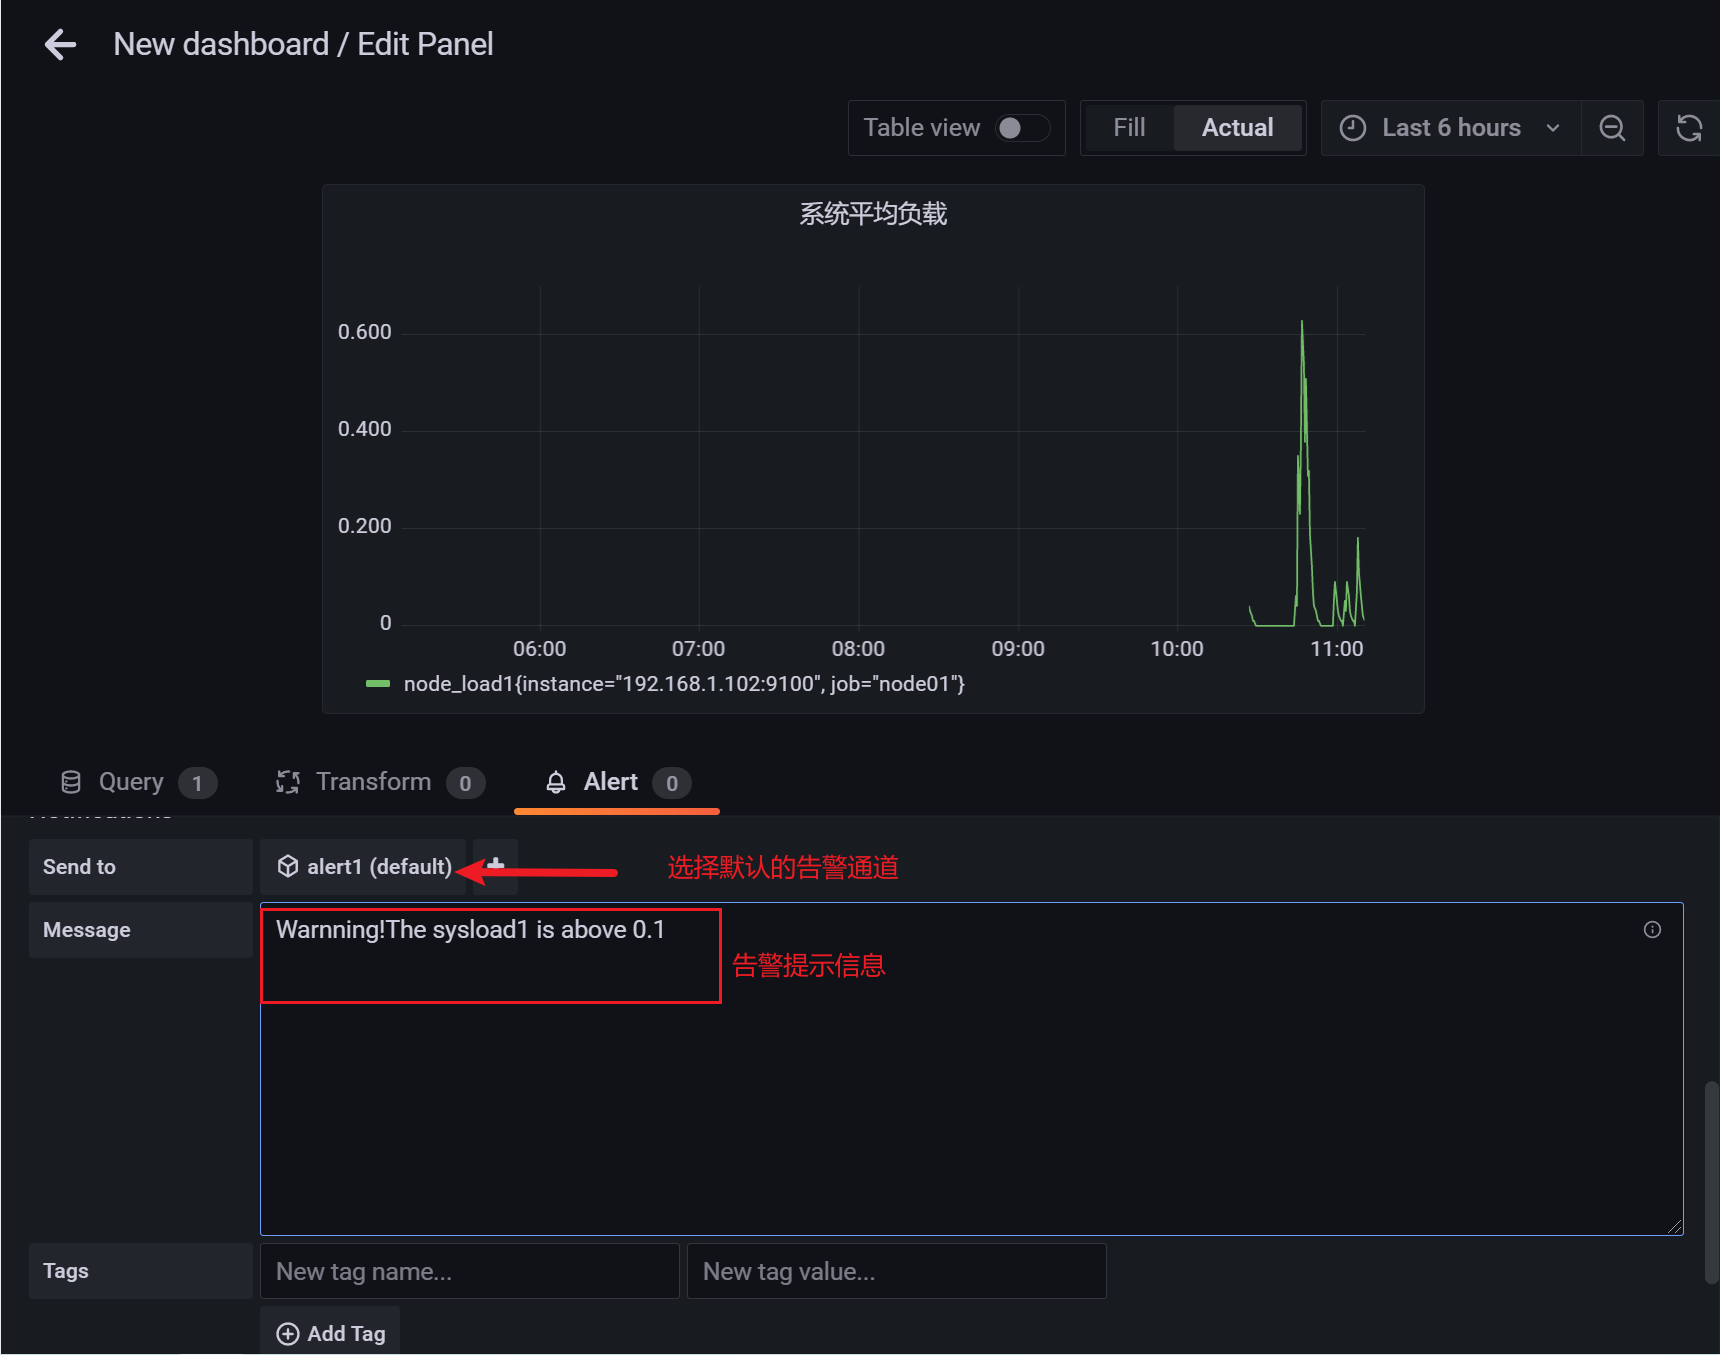
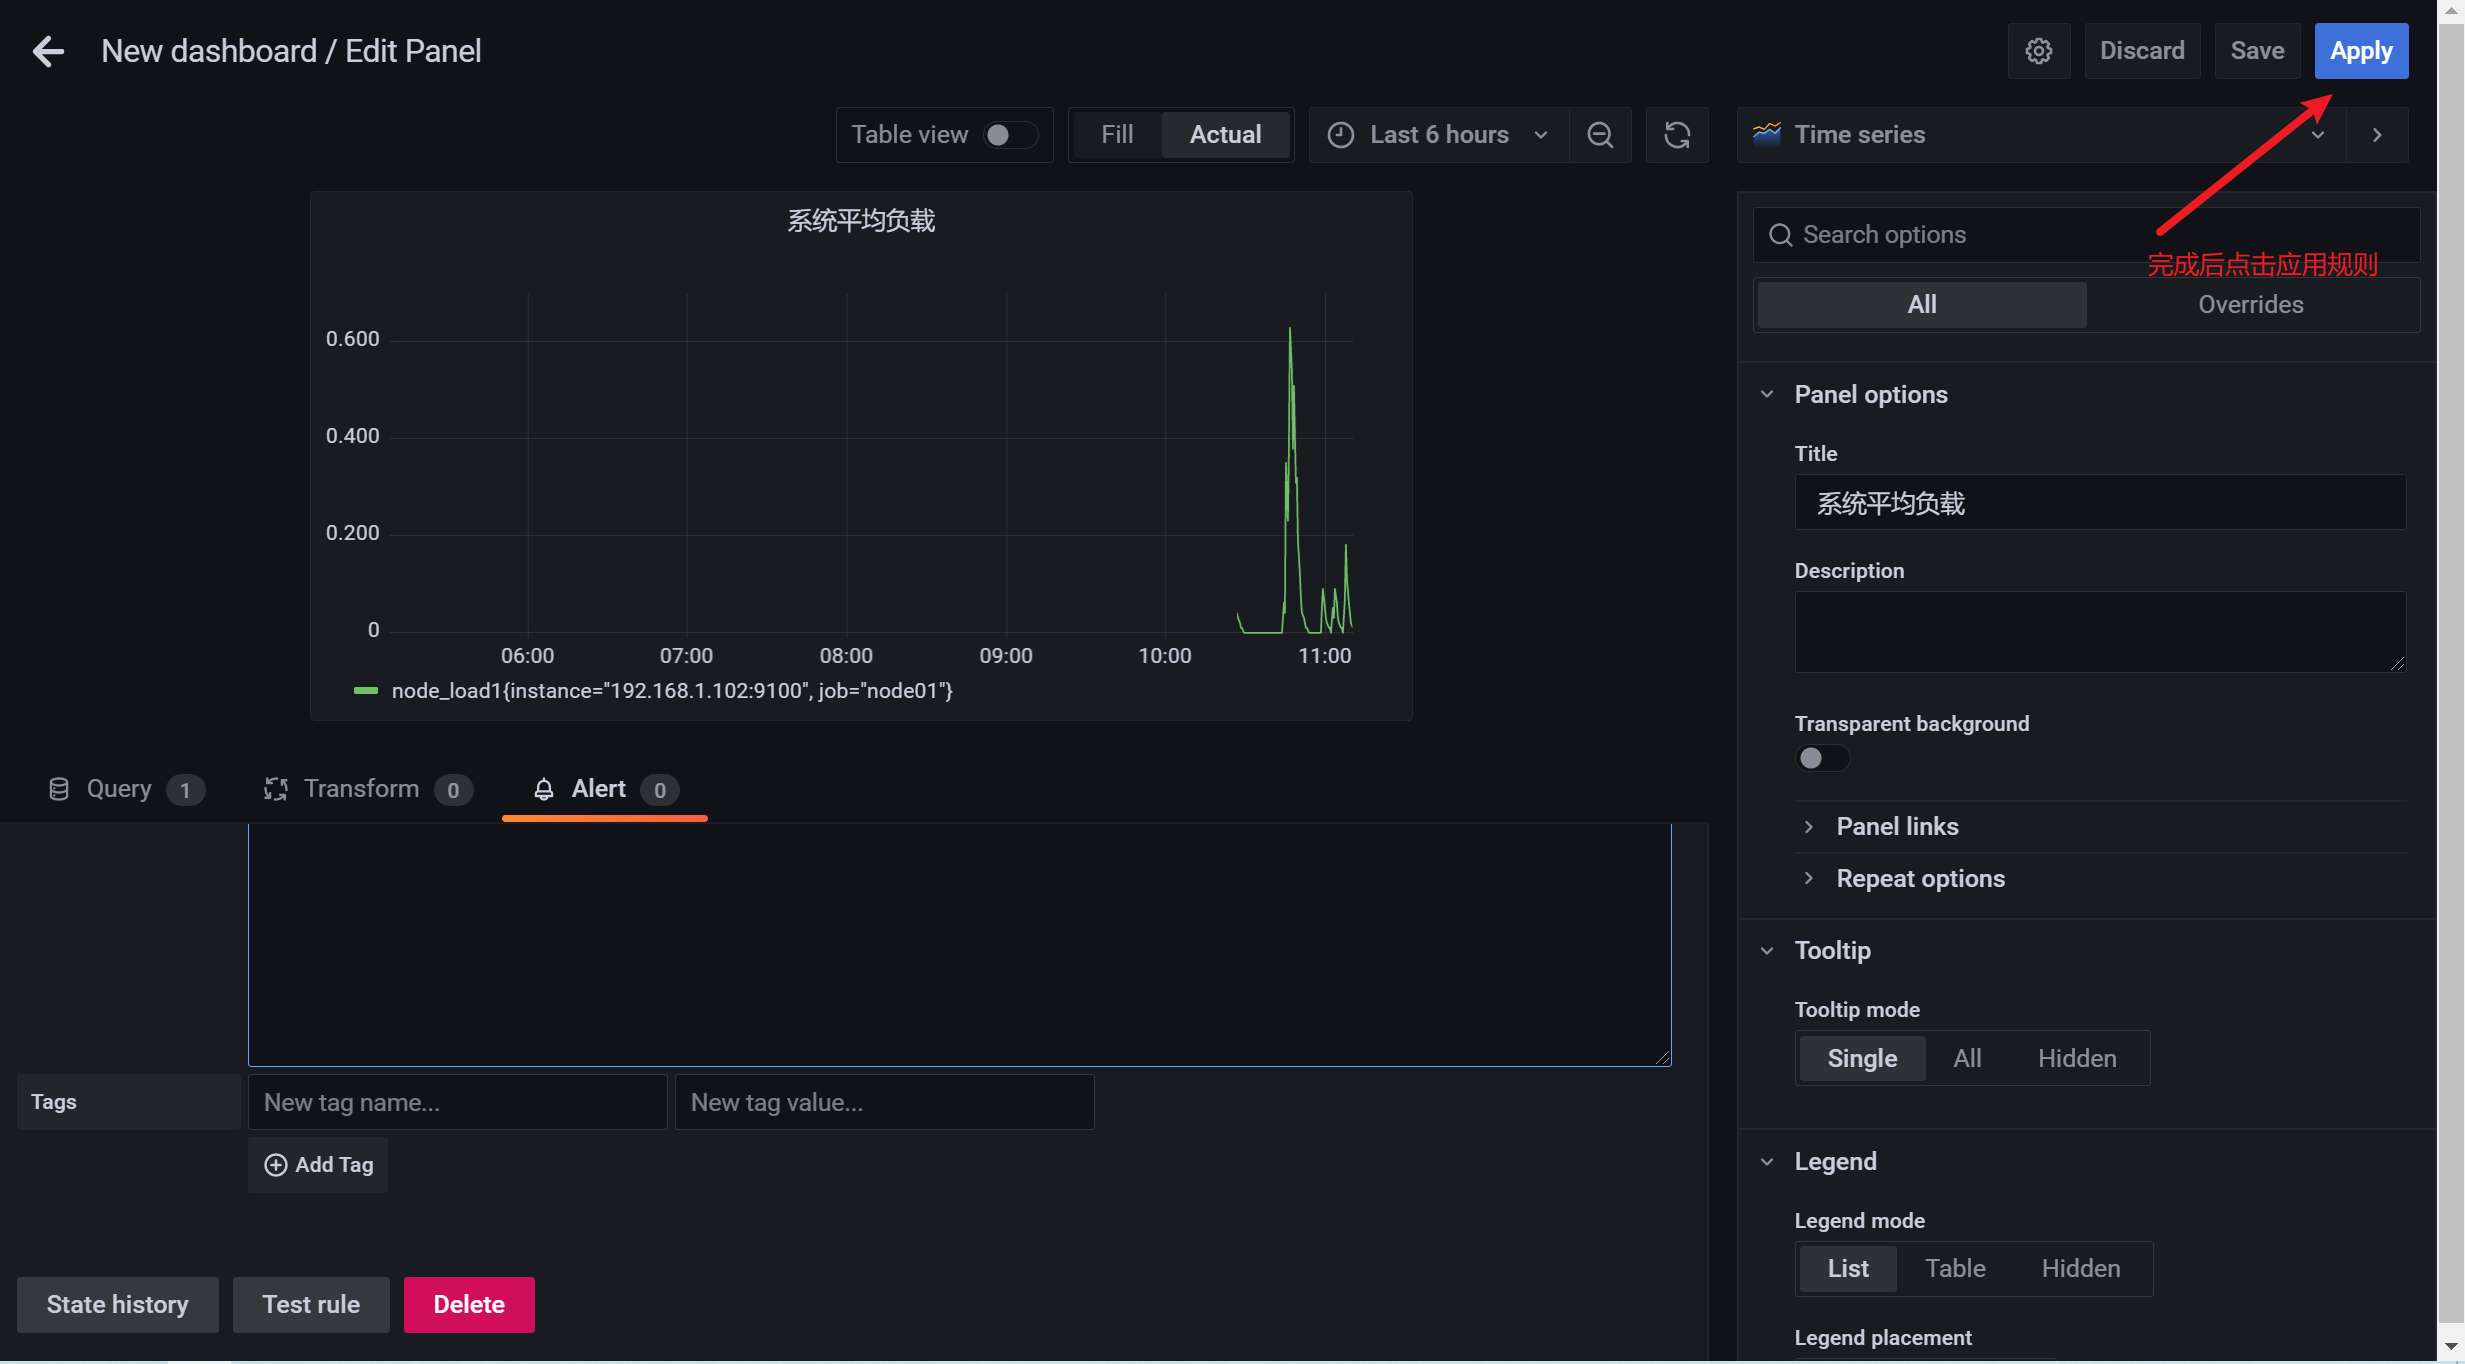
3.10.4 添加告警规则
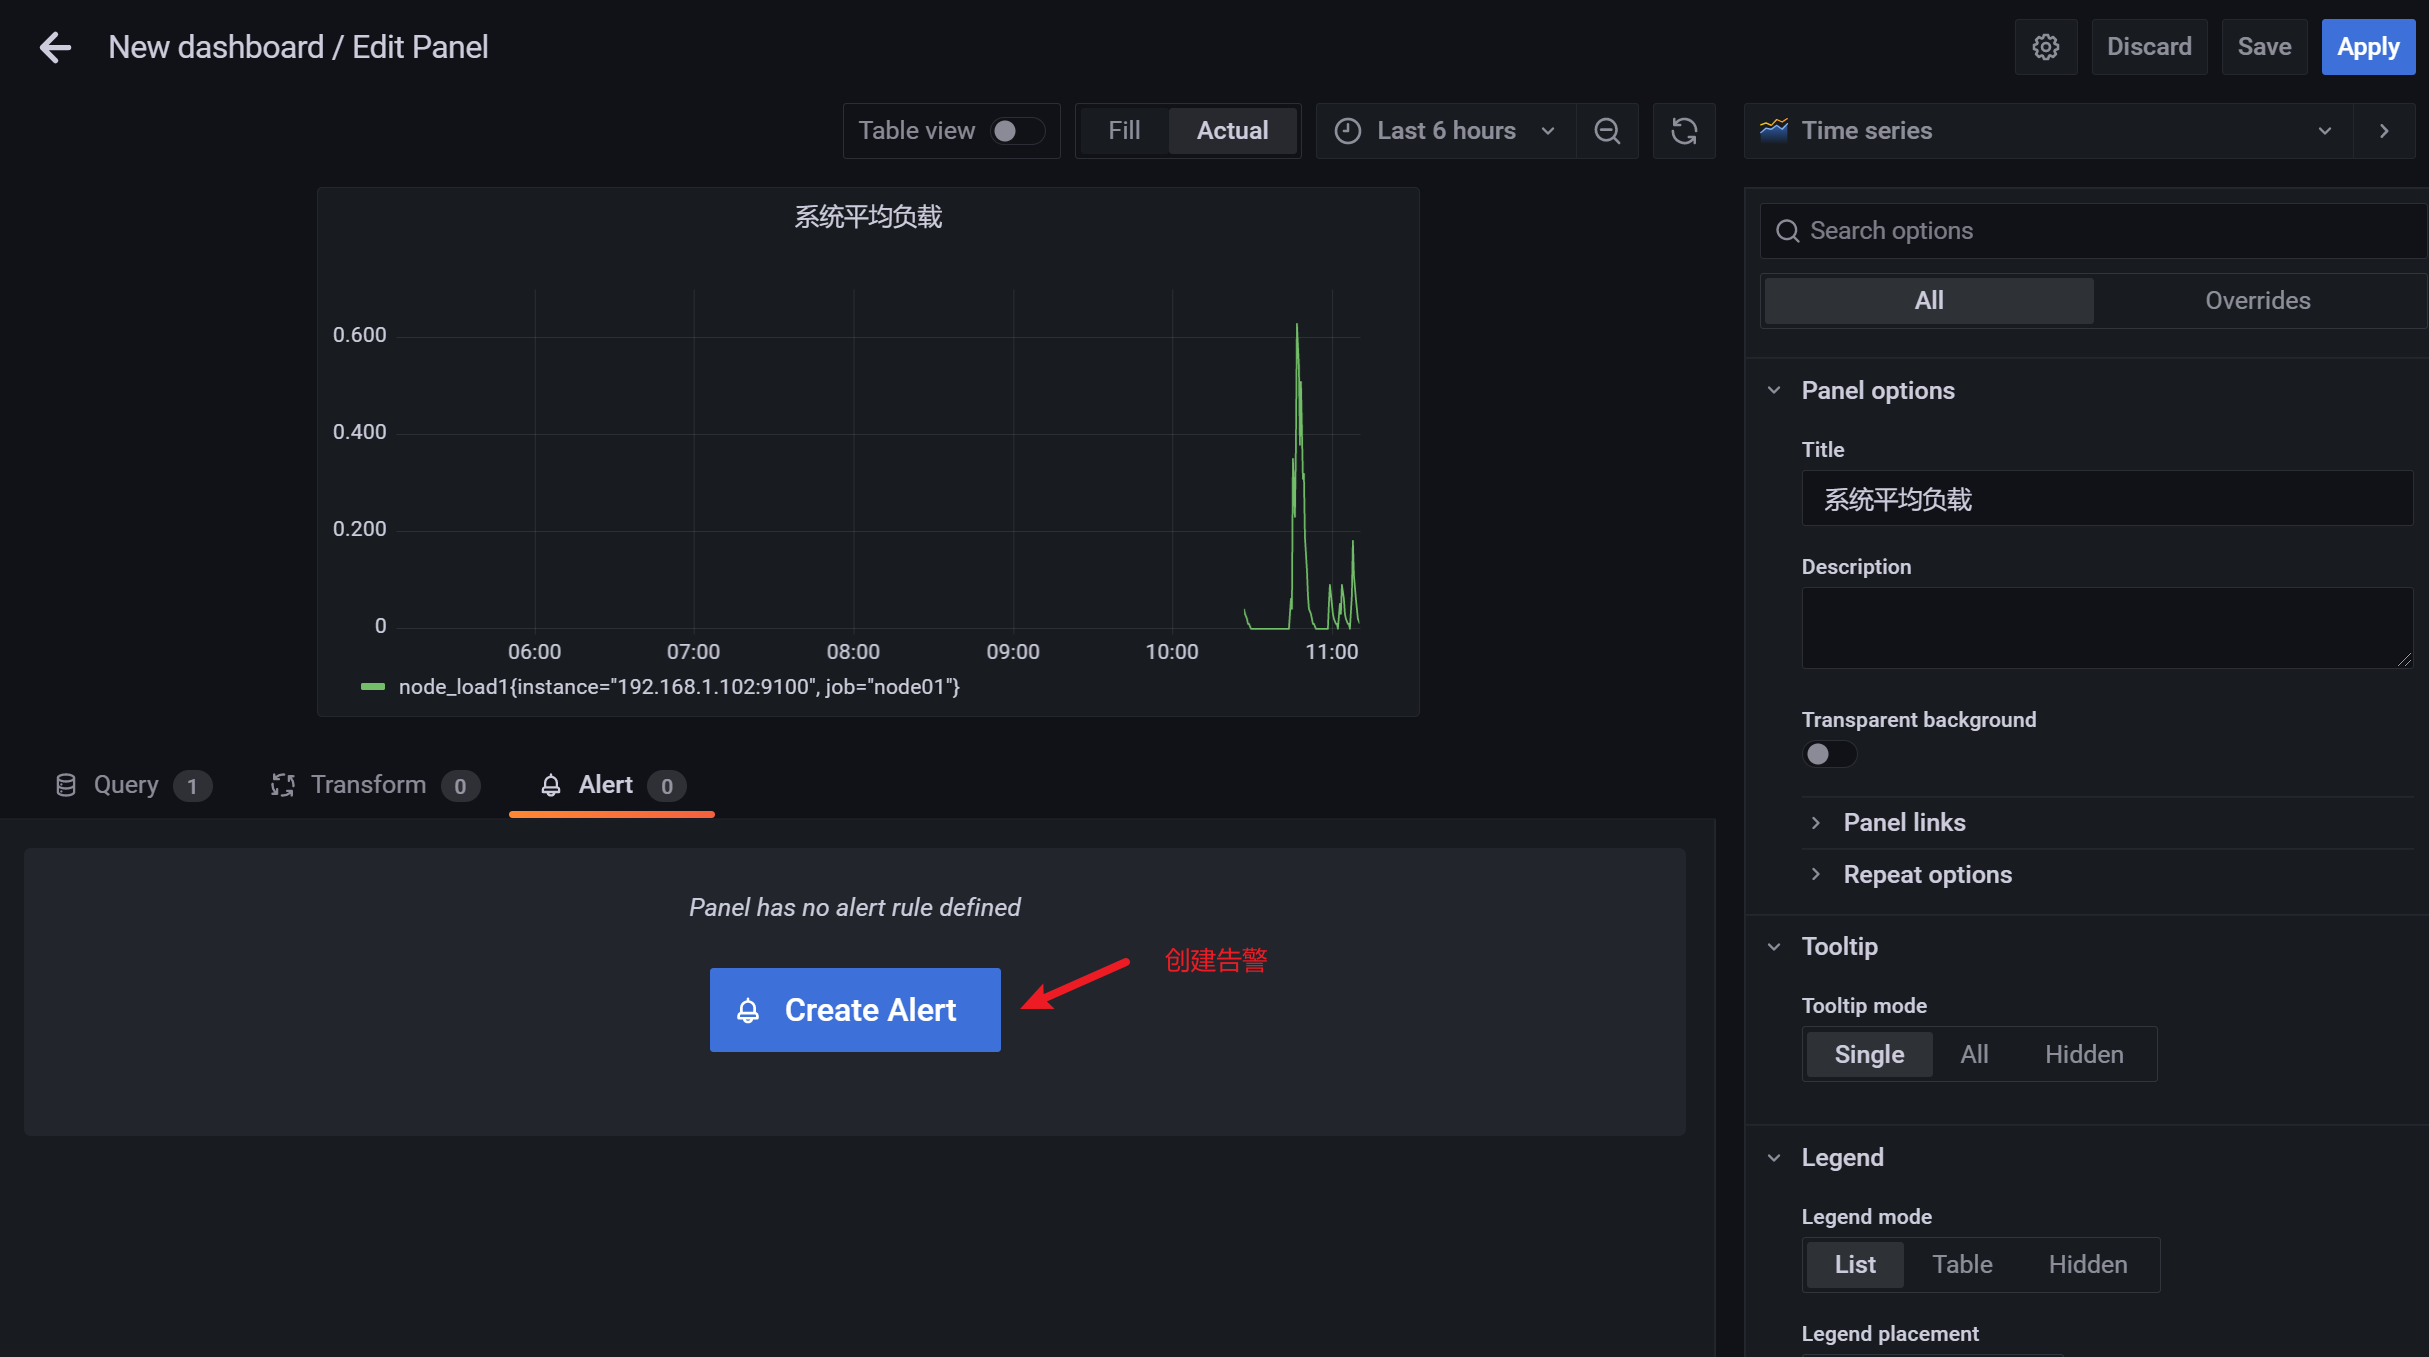
3.10.5 查看监控信息
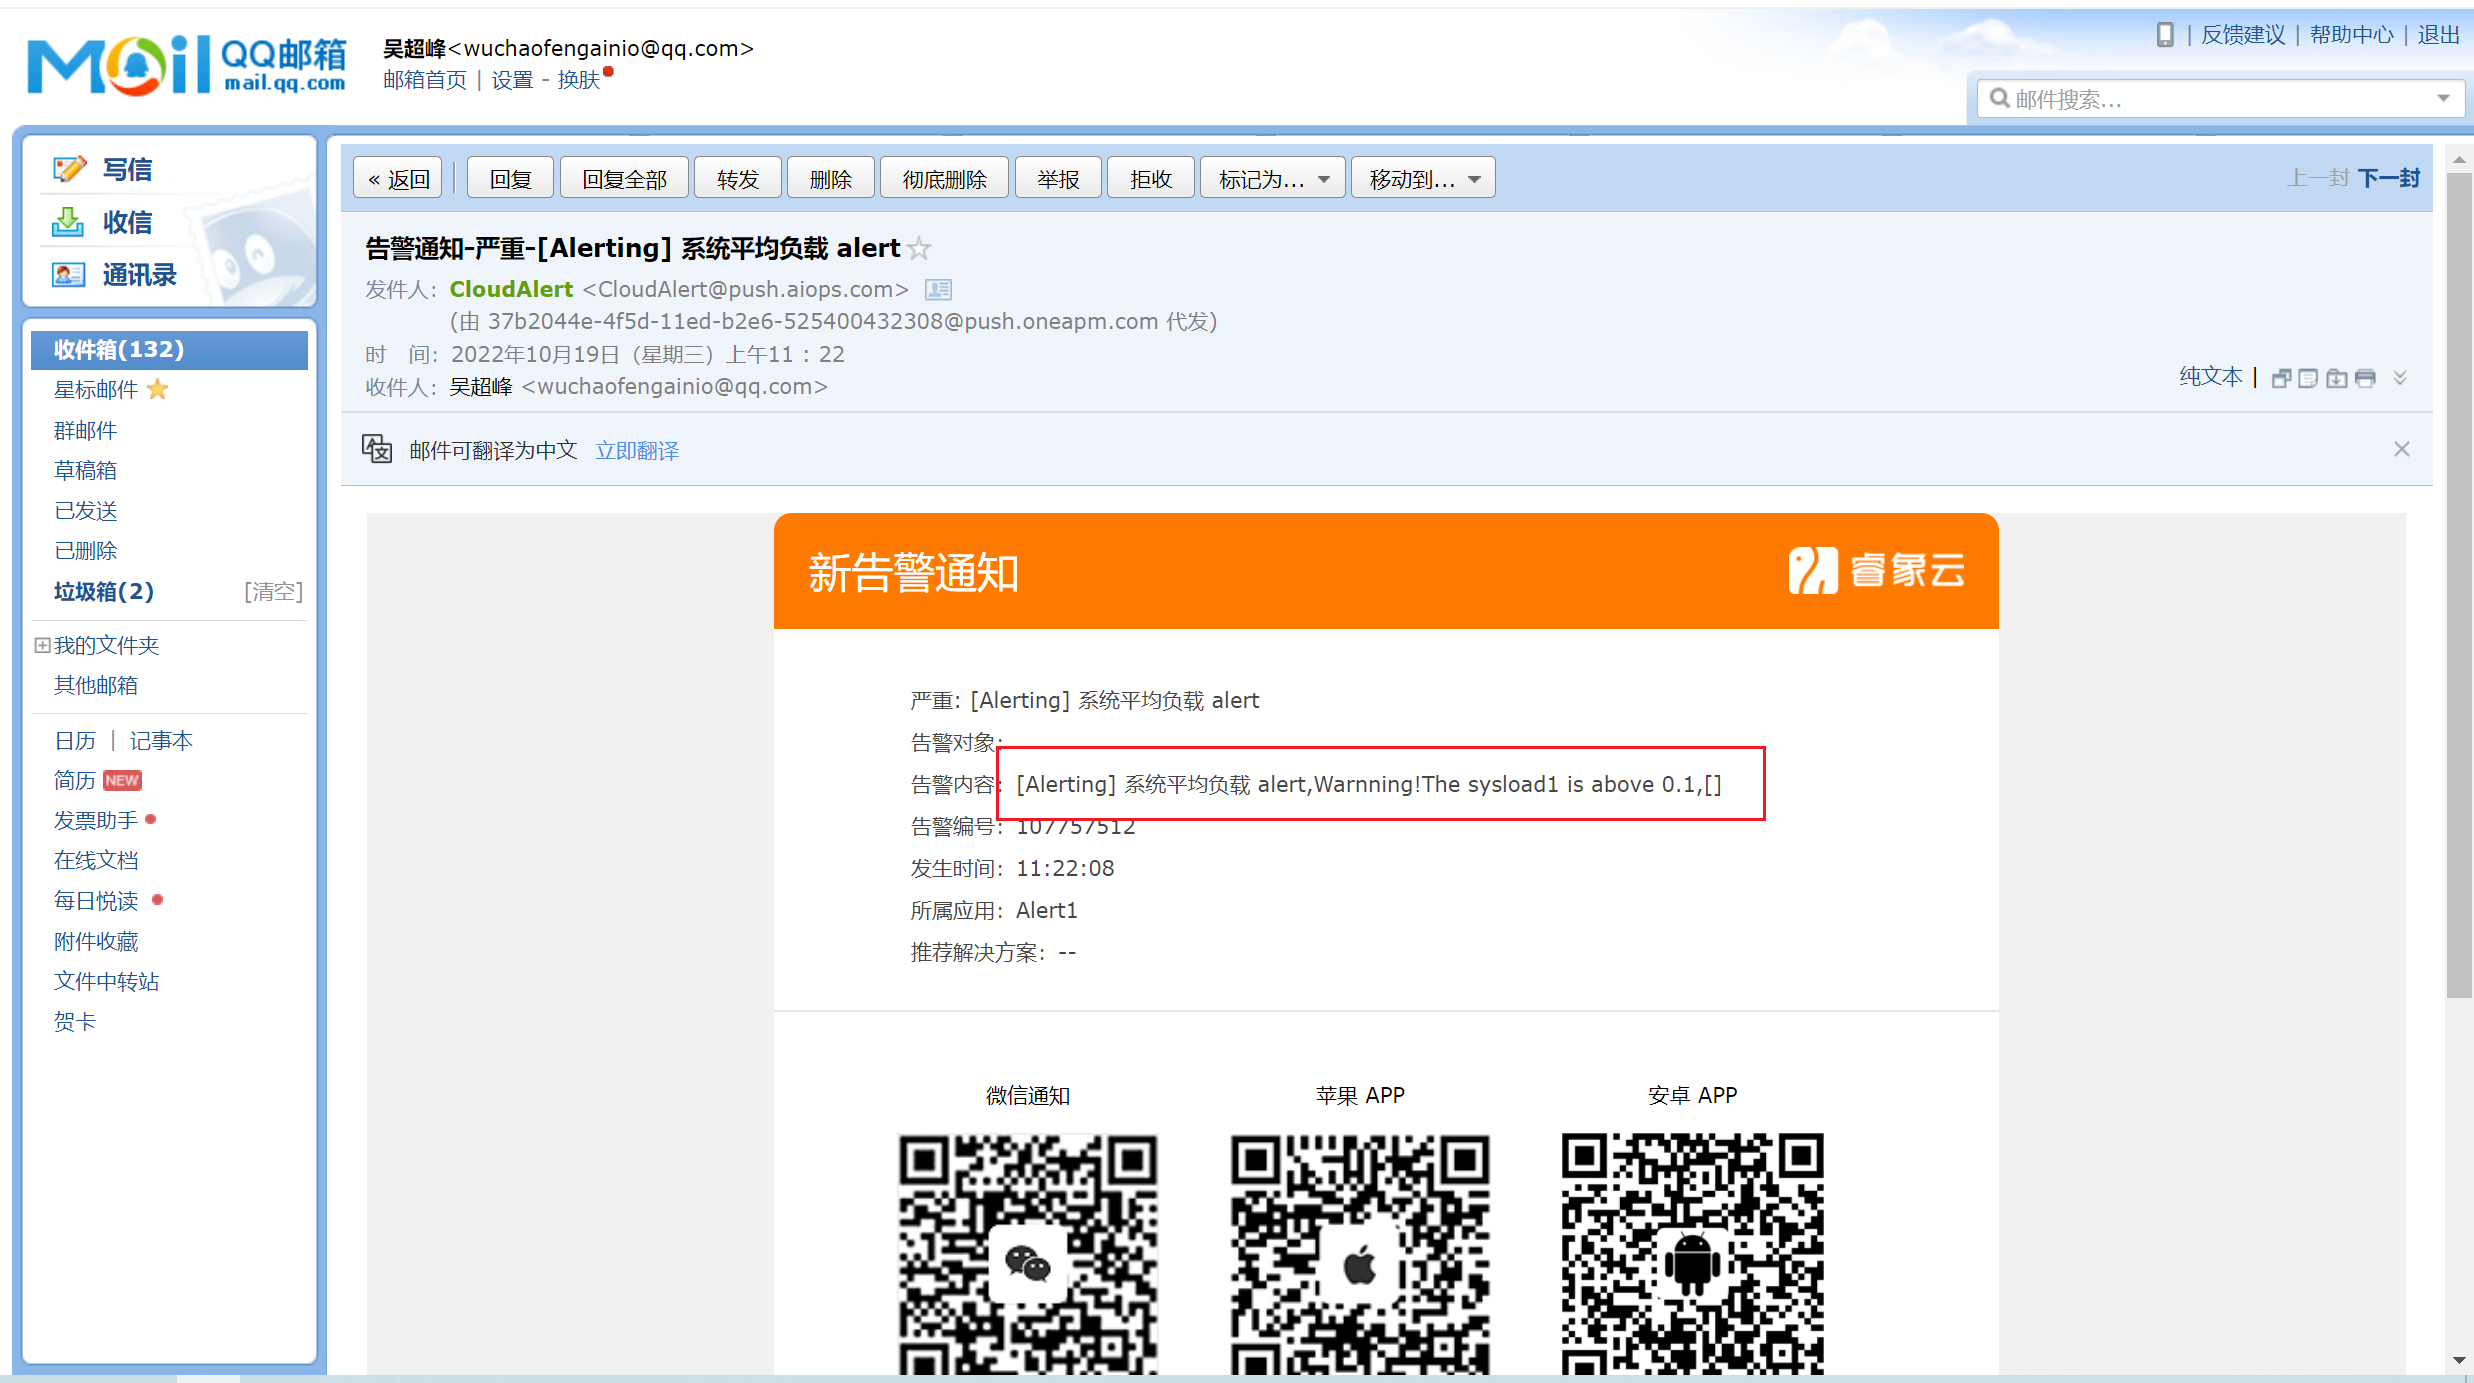
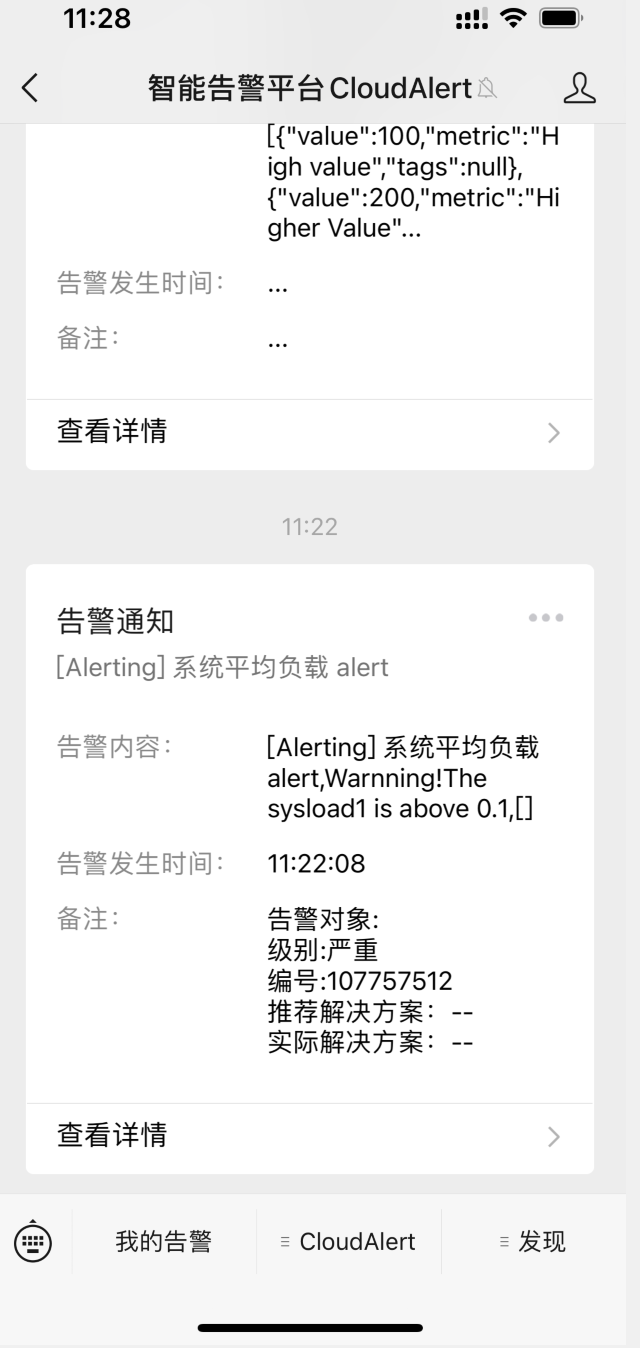
如果系统的平均负载超过了0.1的话,会立即给你自己通过睿象云注册的邮箱发送邮件告警,我这里通过QQ邮箱发送的告警
3.11 联邦配置
3.11.1 架构拓扑如下
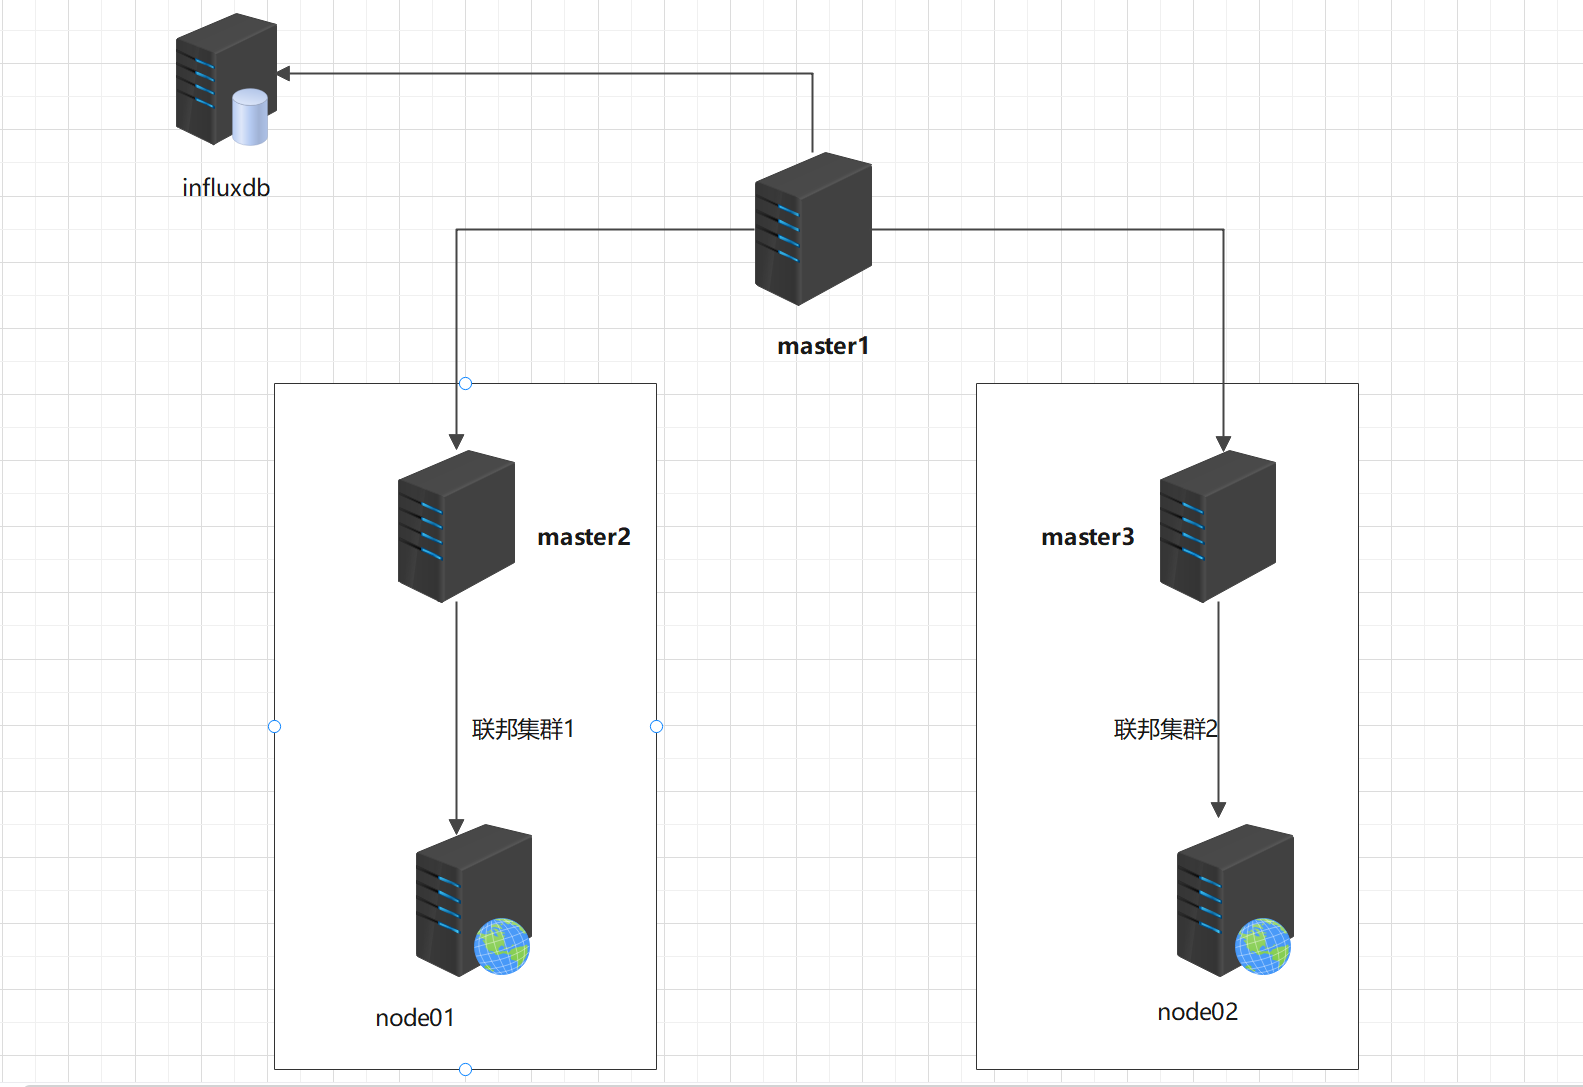
192.168.1.100    master1
192.168.1.101    master2
192.168.1.102    master3
192.168.1.103    node01
192.168.1.104    node02
192.168.1.105    influxdb
3.11.2 架构拓扑解析
该架构采用的是3主2从的架构,master2和master3用于收集node1和node2的指标数据,收集到的数据汇总到master1,master1的数据远程存储到第三方的TSDB数据库-influxdb.
3.11.3 部署过程
1)prometheus 主server和prometheus联邦节点分别部署prometheus
1、解压压缩包
[root@prometheus-master1 prometheus软件包]# tar zxvf prometheus-2.32.1.linux-amd64.tar.gz -C /usr/local/
prometheus-2.32.1.linux-amd64/
prometheus-2.32.1.linux-amd64/consoles/
prometheus-2.32.1.linux-amd64/consoles/index.html.example
prometheus-2.32.1.linux-amd64/consoles/node-cpu.html
prometheus-2.32.1.linux-amd64/consoles/node-disk.html
prometheus-2.32.1.linux-amd64/consoles/node-overview.html
prometheus-2.32.1.linux-amd64/consoles/node.html
prometheus-2.32.1.linux-amd64/consoles/prometheus-overview.html
prometheus-2.32.1.linux-amd64/consoles/prometheus.html
prometheus-2.32.1.linux-amd64/console_libraries/
prometheus-2.32.1.linux-amd64/console_libraries/menu.lib
prometheus-2.32.1.linux-amd64/console_libraries/prom.lib
prometheus-2.32.1.linux-amd64/prometheus.yml
prometheus-2.32.1.linux-amd64/LICENSE
prometheus-2.32.1.linux-amd64/NOTICE
prometheus-2.32.1.linux-amd64/prometheus
prometheus-2.32.1.linux-amd64/promtool
注意:联邦节点同步操作
2、配置master2和master3收集node节点的数据
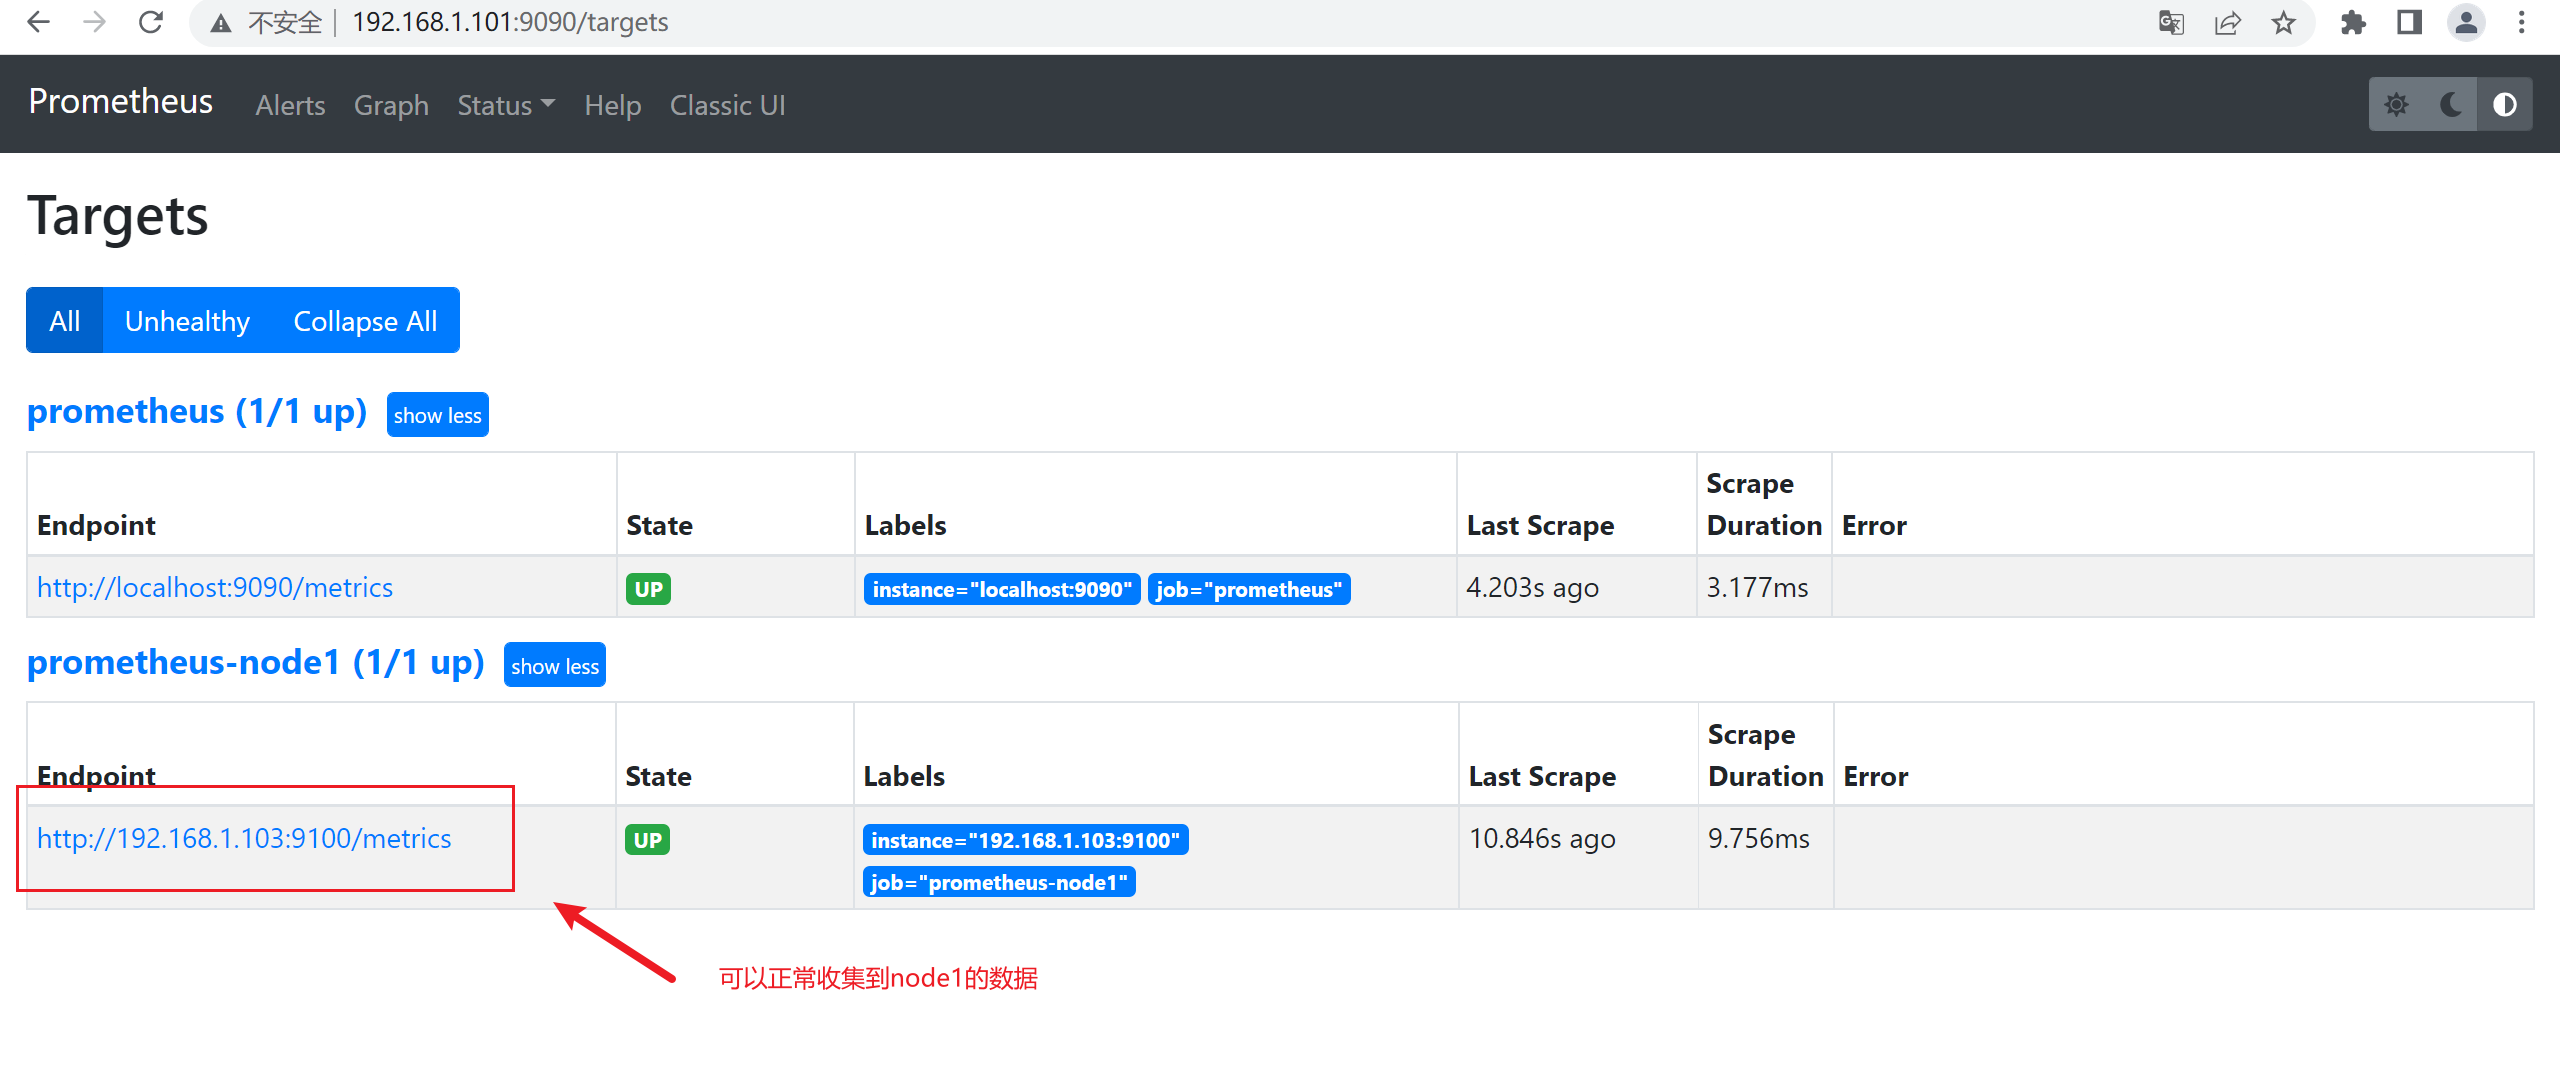
联邦集群1 收集node1的数据
#编辑prometheus.yaml文件添加下面node1节点监控信息
- job_name: "prometheus-node1"
static_configs:
- targets: ["192.168.1.103:9100"] ##node节点的ip
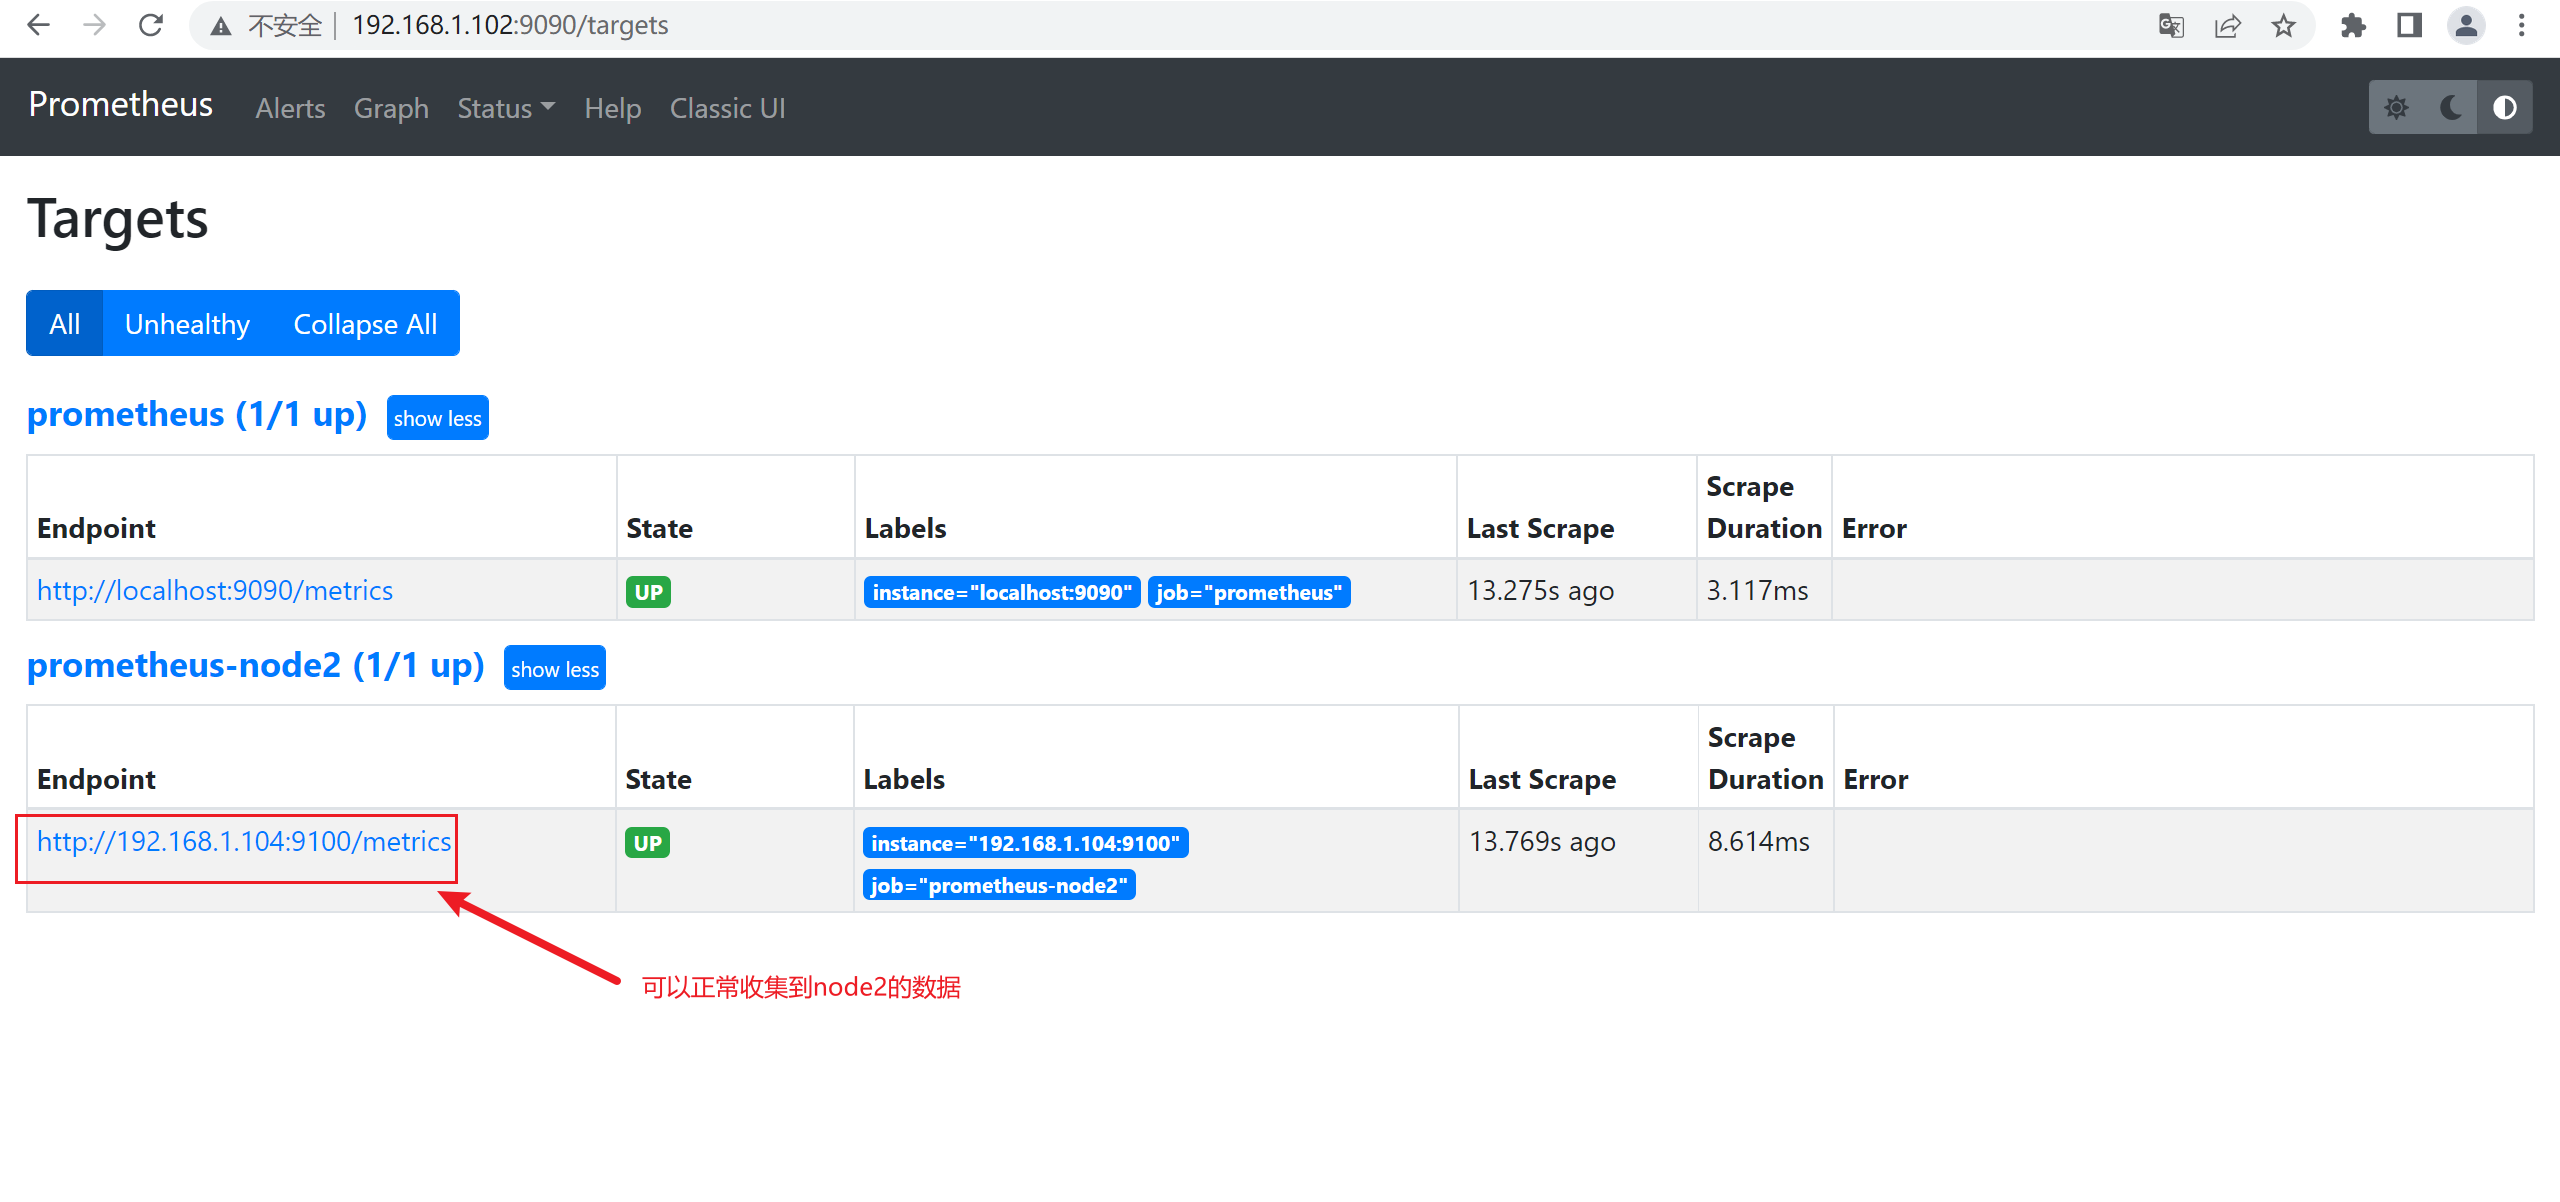
联邦集群2 收集node2的数据
#编辑prometheus.yaml文件添加下面node2节点监控信息
- job_name: "prometheus-node2"
static_configs:
- targets: ["192.168.1.104:9100"] ##node节点的ip
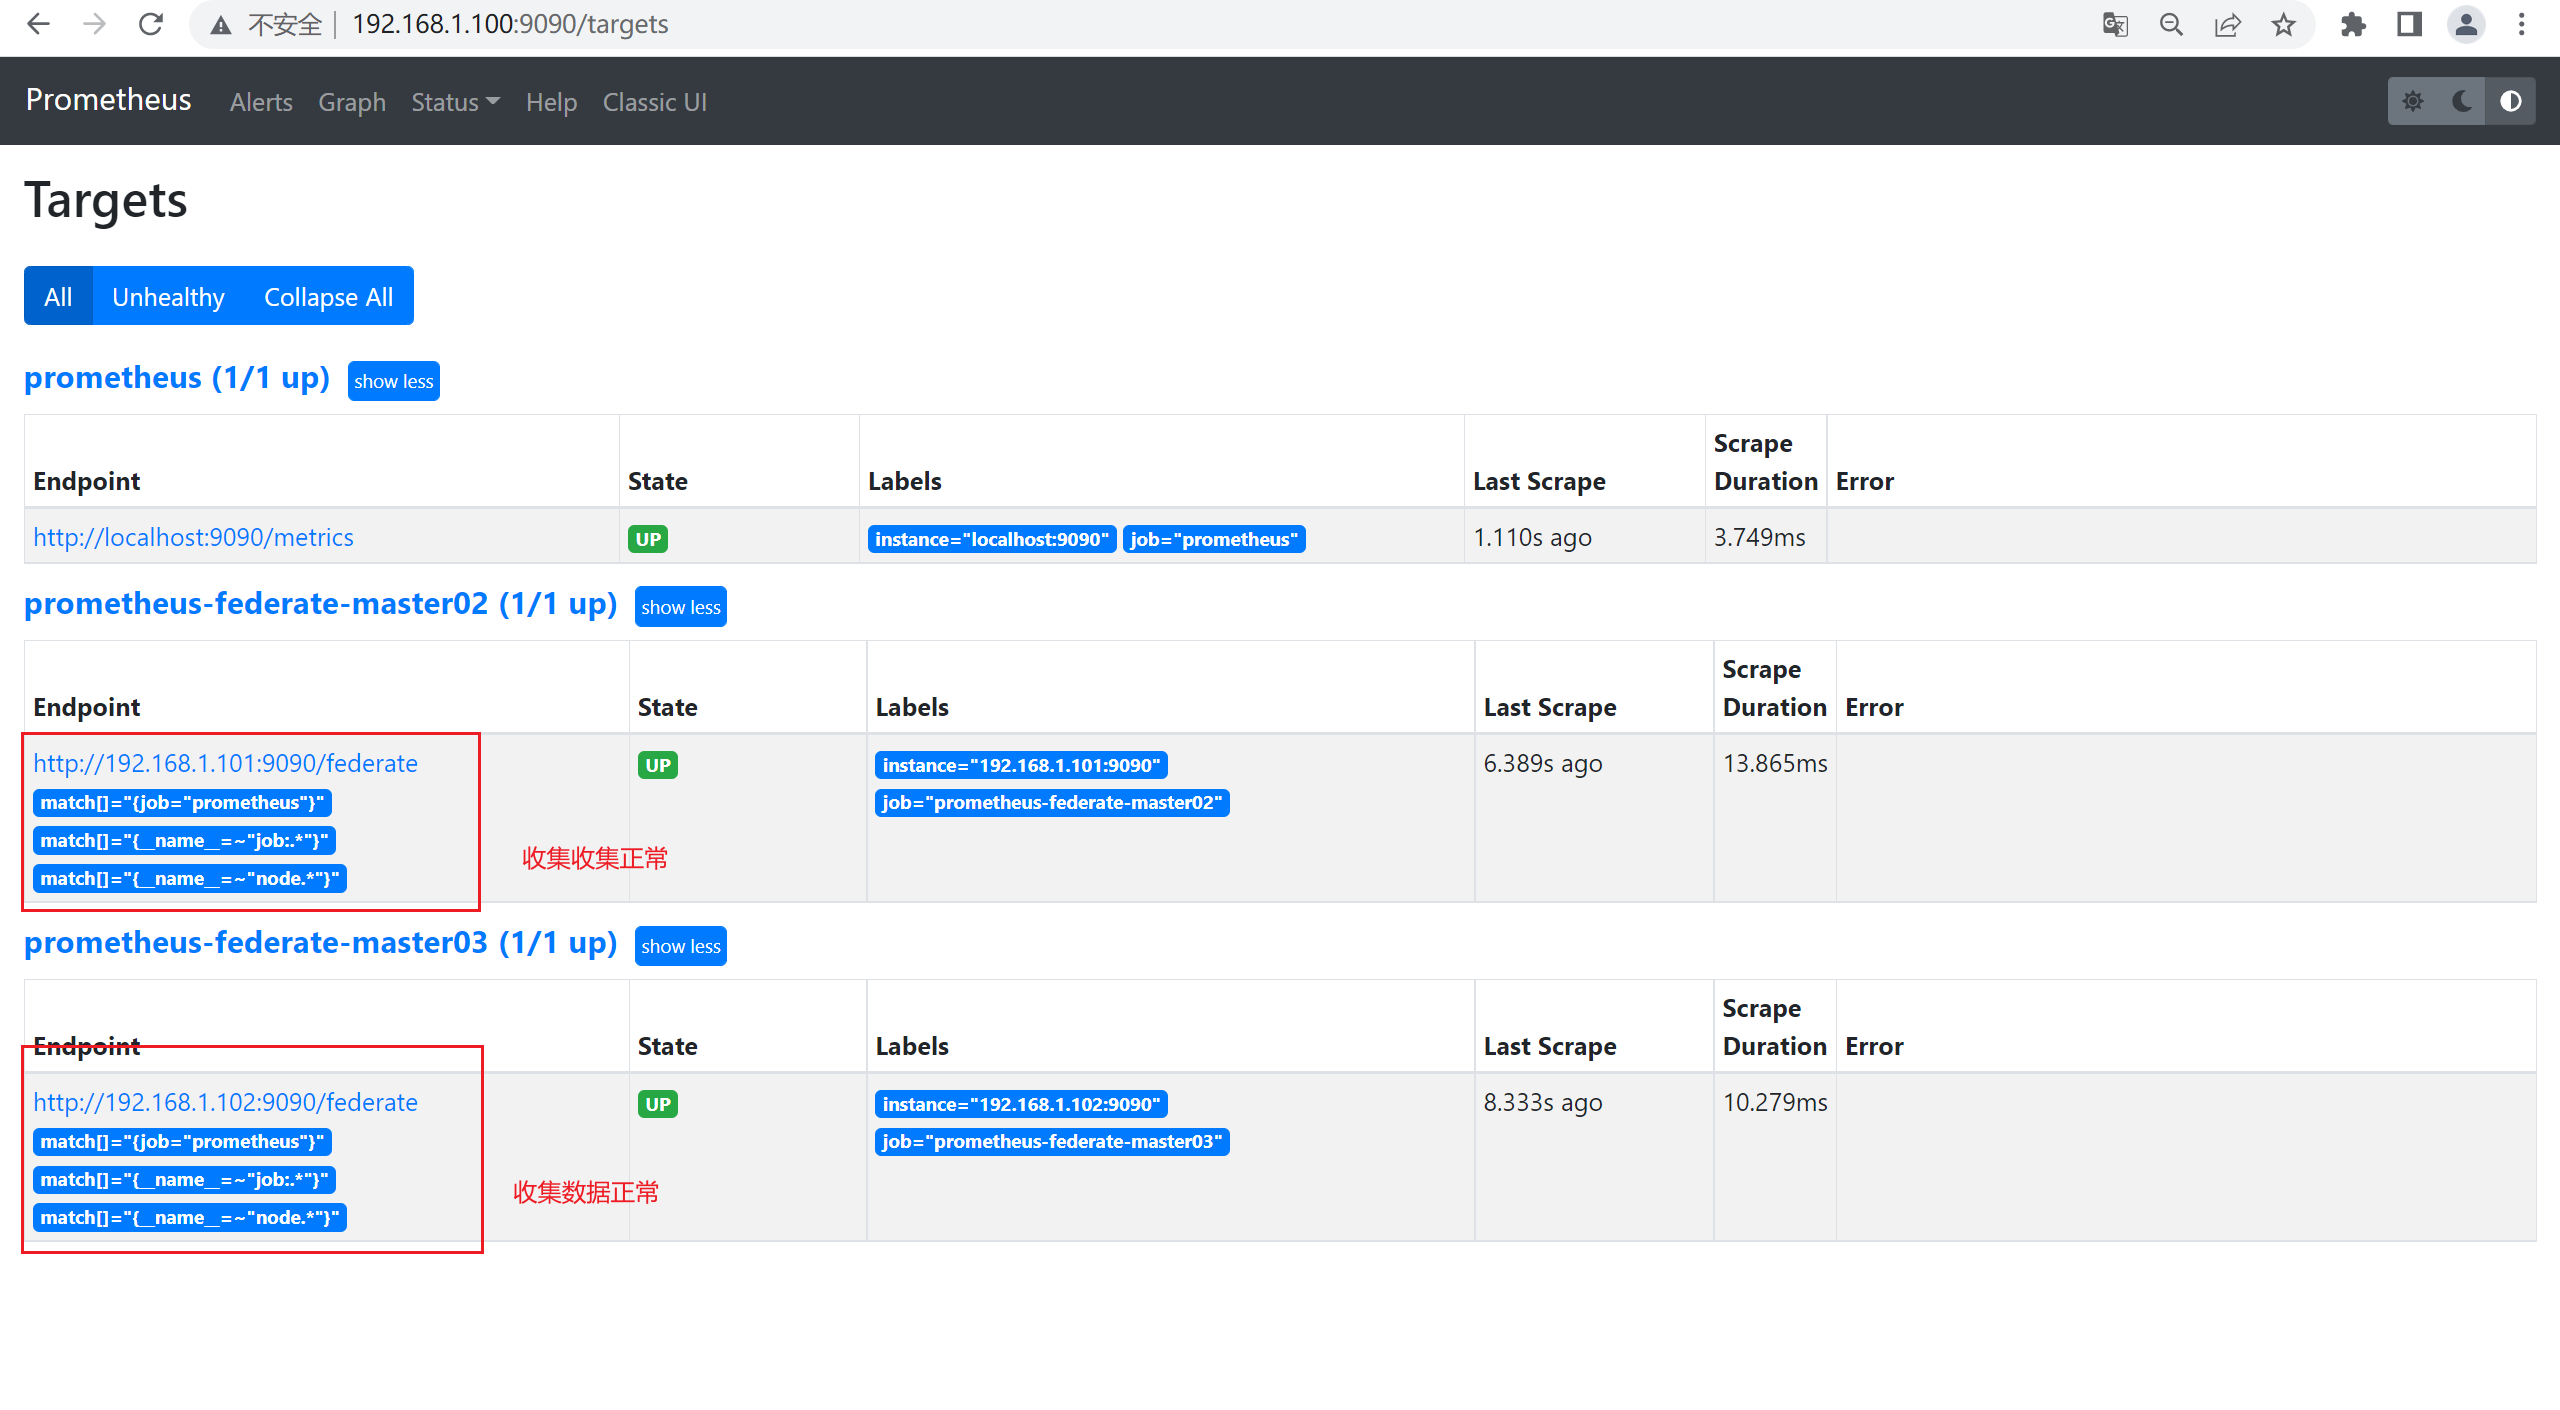
3、配置master1收集master2和master3的信息
# 添加以下配置,增加联邦集群节点 到prometheus server节点。
- job_name: 'prometheus-federate-master02'
scrape_interval: 10s # 数据拉取时间间隔
honor_labels: true #保持原标签不变
metrics_path: '/federate' #metric
params:
'match[]':
- '{job="prometheus"}'
- '{__name__=~"job:.*"}'
- '{__name__=~"node.*"}'
static_configs:
- targets: ["192.168.1.101:9090"]
- job_name: 'prometheus-federate-master03'
scrape_interval: 10s
honor_labels: true
metrics_path: '/federate'
params:
'match[]':
- '{job="prometheus"}'
- '{__name__=~"job:.*"}'
- '{__name__=~"node.*"}'
static_configs:
- targets: ["192.168.1.102:9090"]
2)部署node节点
1、node1和node2节点安装node_exporter
[root@node1 ~]# tar zxvf node_exporter-1.3.1.linux-amd64.tar.gz -C /usr/local/
node_exporter-1.3.1.linux-amd64/
node_exporter-1.3.1.linux-amd64/LICENSE
node_exporter-1.3.1.linux-amd64/NOTICE
node_exporter-1.3.1.linux-amd64/node_exporter


[root@node2 ~]# tar zxvf node_exporter-1.3.1.linux-amd64.tar.gz -C /usr/local/
node_exporter-1.3.1.linux-amd64/
node_exporter-1.3.1.linux-amd64/LICENSE
node_exporter-1.3.1.linux-amd64/NOTICE
node_exporter-1.3.1.linux-amd64/node_exporter

2、启动node_exporter
[root@node1 node_exporter-1.3.1.linux-amd64]# nohup ./node_exporter &

[root@node2 node_exporter-1.3.1.linux-amd64]# nohup ./node_exporter &

3、查看端口
[root@node1 node_exporter-1.3.1.linux-amd64]# netstat -antup|grep 9100
tcp6       0      0 :::9100                 :::*                    LISTEN      1808/./node_exporte
[root@node1 node_exporter-1.3.1.linux-amd64]#


[root@node2 node_exporter-1.3.1.linux-amd64]# netstat -antup|grep 9100
tcp6       0      0 :::9100                 :::*                    LISTEN      1808/./node_exporte
[root@node1 node_exporter-1.3.1.linux-amd64]#
3)启动联邦节点的Master
timedatectl set-ntp true
timedatectl set-timezone Asia/Shanghai
chronyc -a makestep
timedatectl status
chronyc sources -v
timedatectl set-local-rtc 0

1、先启动master2和master3
[root@prometheus-master2 prometheus-2.32.1.linux-amd64]# nohup ./prometheus --config.file=/usr/local/prometheus-2.32.1.linux-amd64/prometheus.yml &


[root@prometheus-master3 prometheus-2.32.1.linux-amd64]#  nohup ./prometheus --config.file=/usr/local/prometheus-2.32.1.linux-amd64/prometheus.yml &

2、启动master1
 [root@prometheus-master1 prometheus-2.32.1.linux-amd64]#nohup ./prometheus --config.file=/usr/local/prometheus-2.32.1.linux-amd64/prometheus.yml &


3、查看端口是否正常
[root@prometheus-master1 prometheus-2.32.1.linux-amd64]# netstat -antup |grep 9090
tcp        0      0 192.168.1.100:55928     192.168.1.102:9090      ESTABLISHED 2502/./prometheus
tcp        0      0 192.168.1.100:45108     192.168.1.101:9090      ESTABLISHED 2502/./prometheus
tcp6       0      0 :::9090                 :::*                    LISTEN      2502/./prometheus
tcp6       0      0 ::1:9090                ::1:45946               ESTABLISHED 2502/./prometheus
tcp6       0      0 ::1:45946               ::1:9090                ESTABLISHED 2502/./prometheus
4)在master2和master3上查看数据
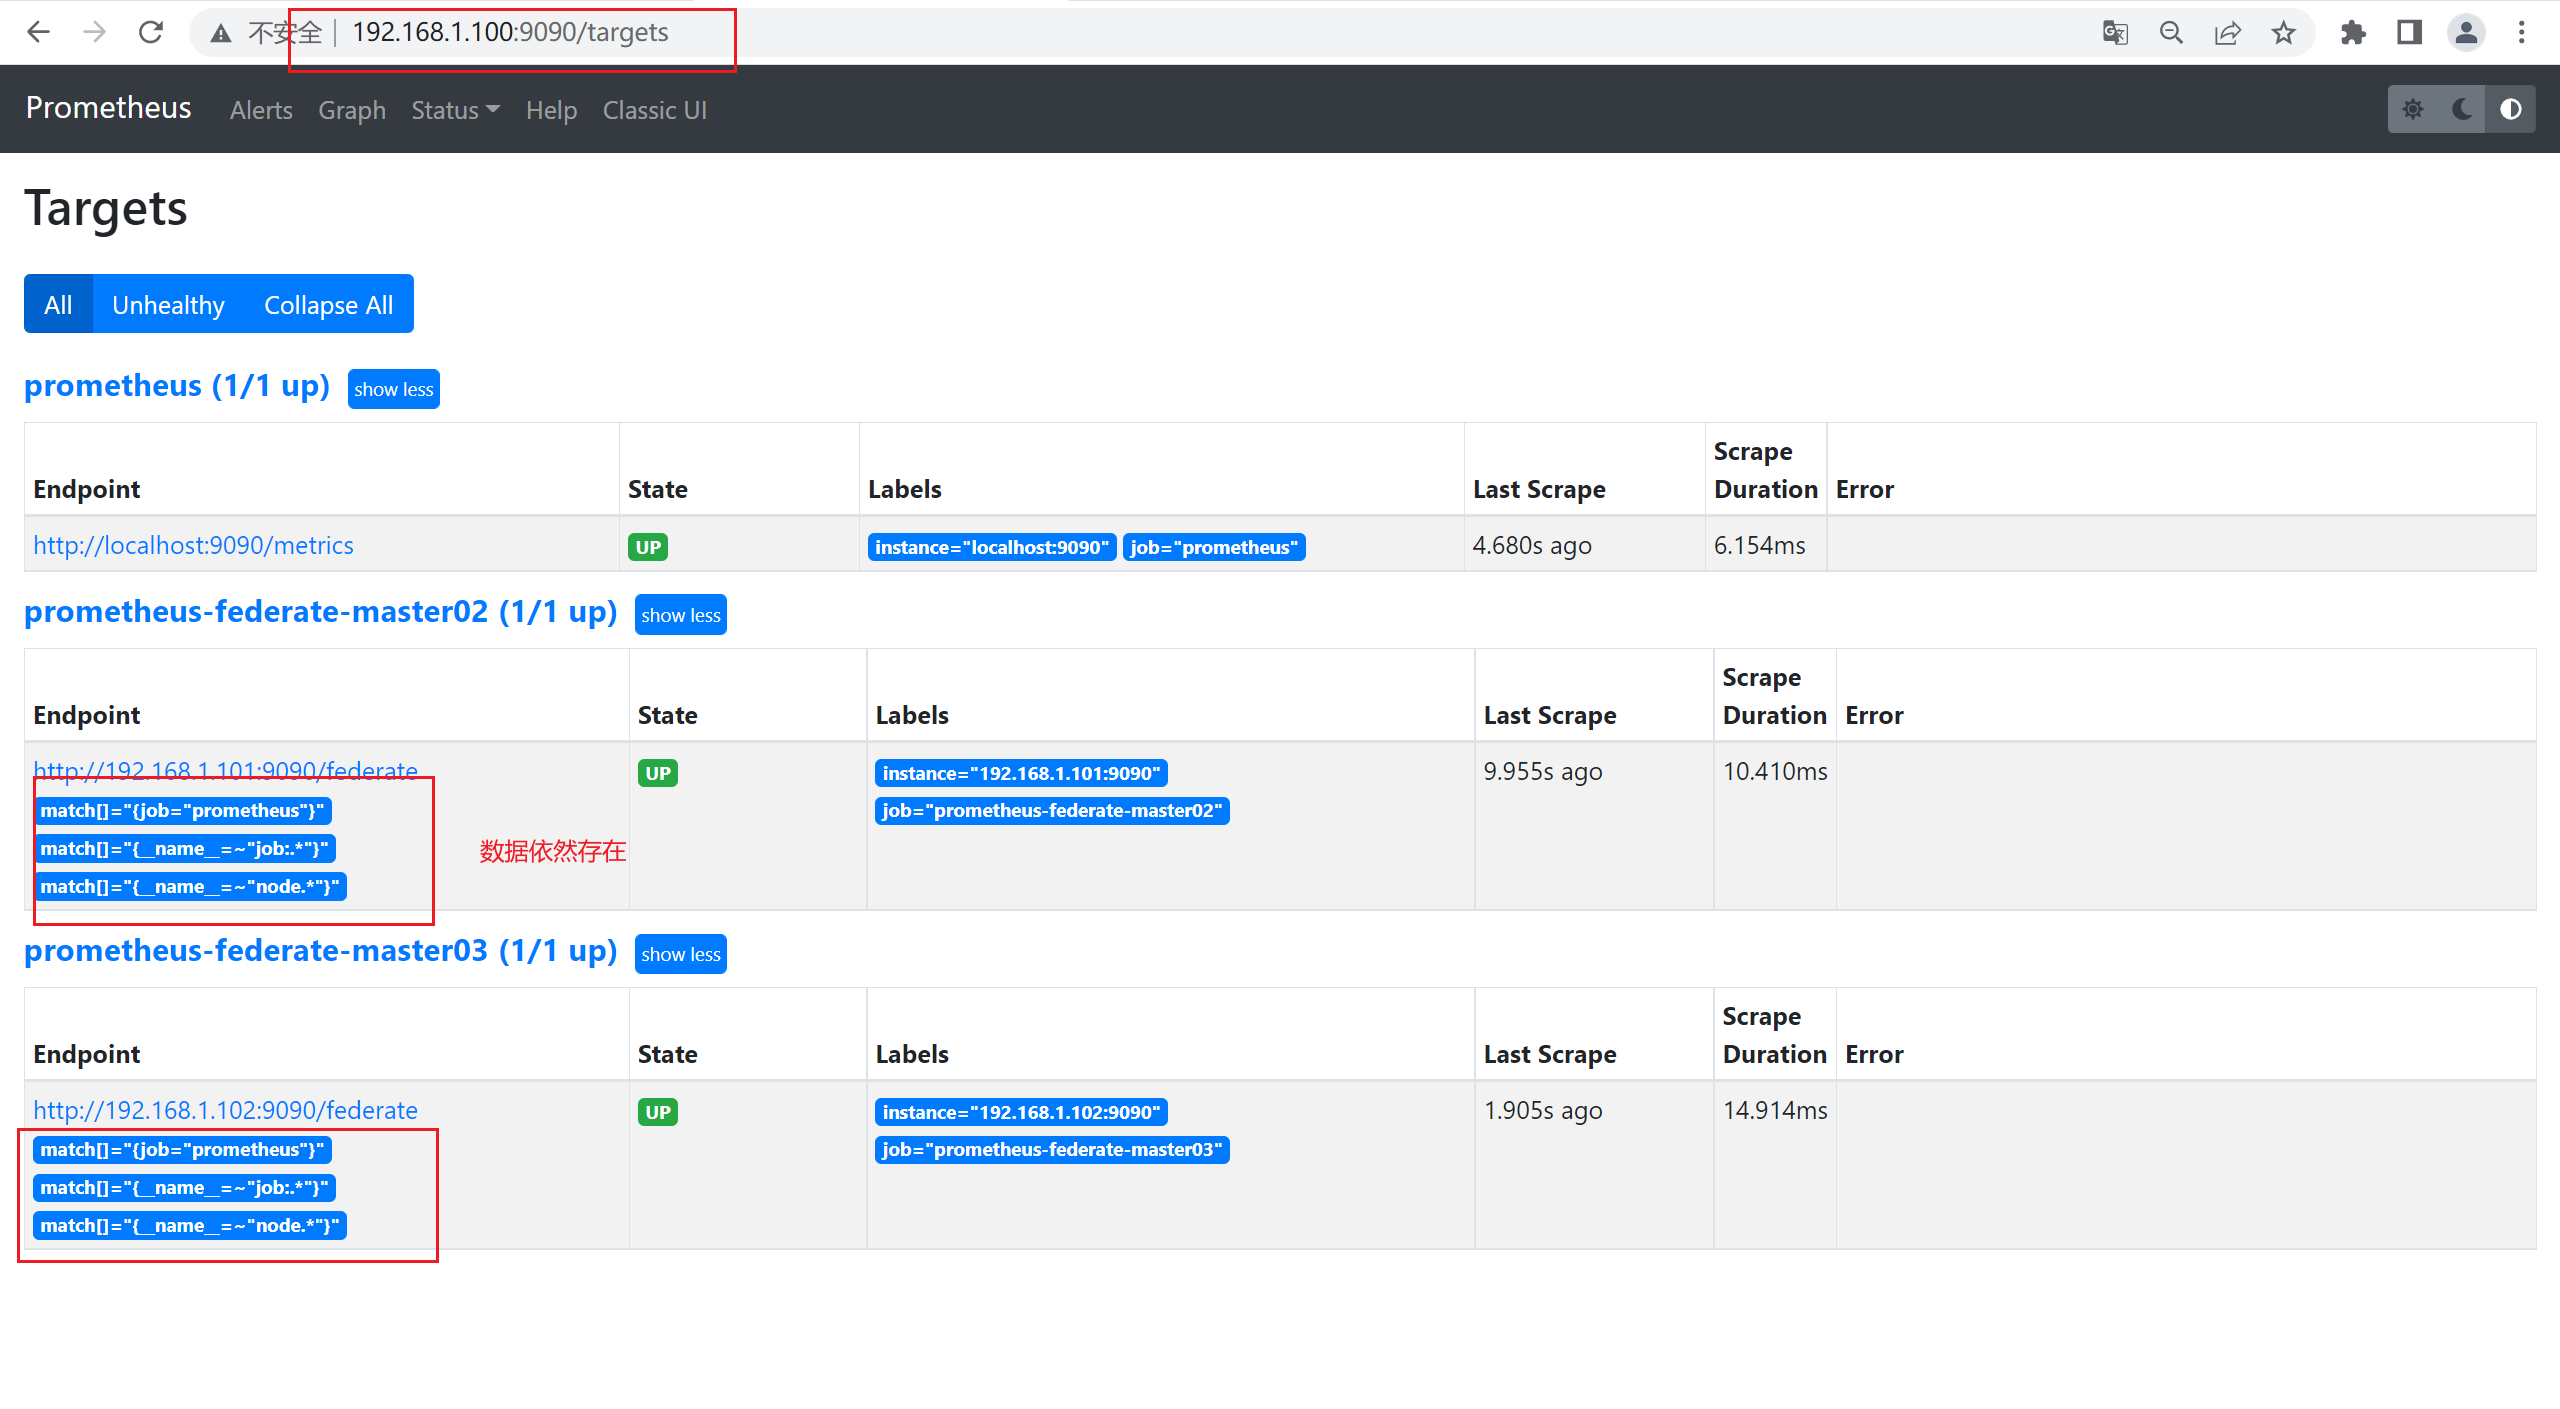
5)在master1上查看master2和master3的数据
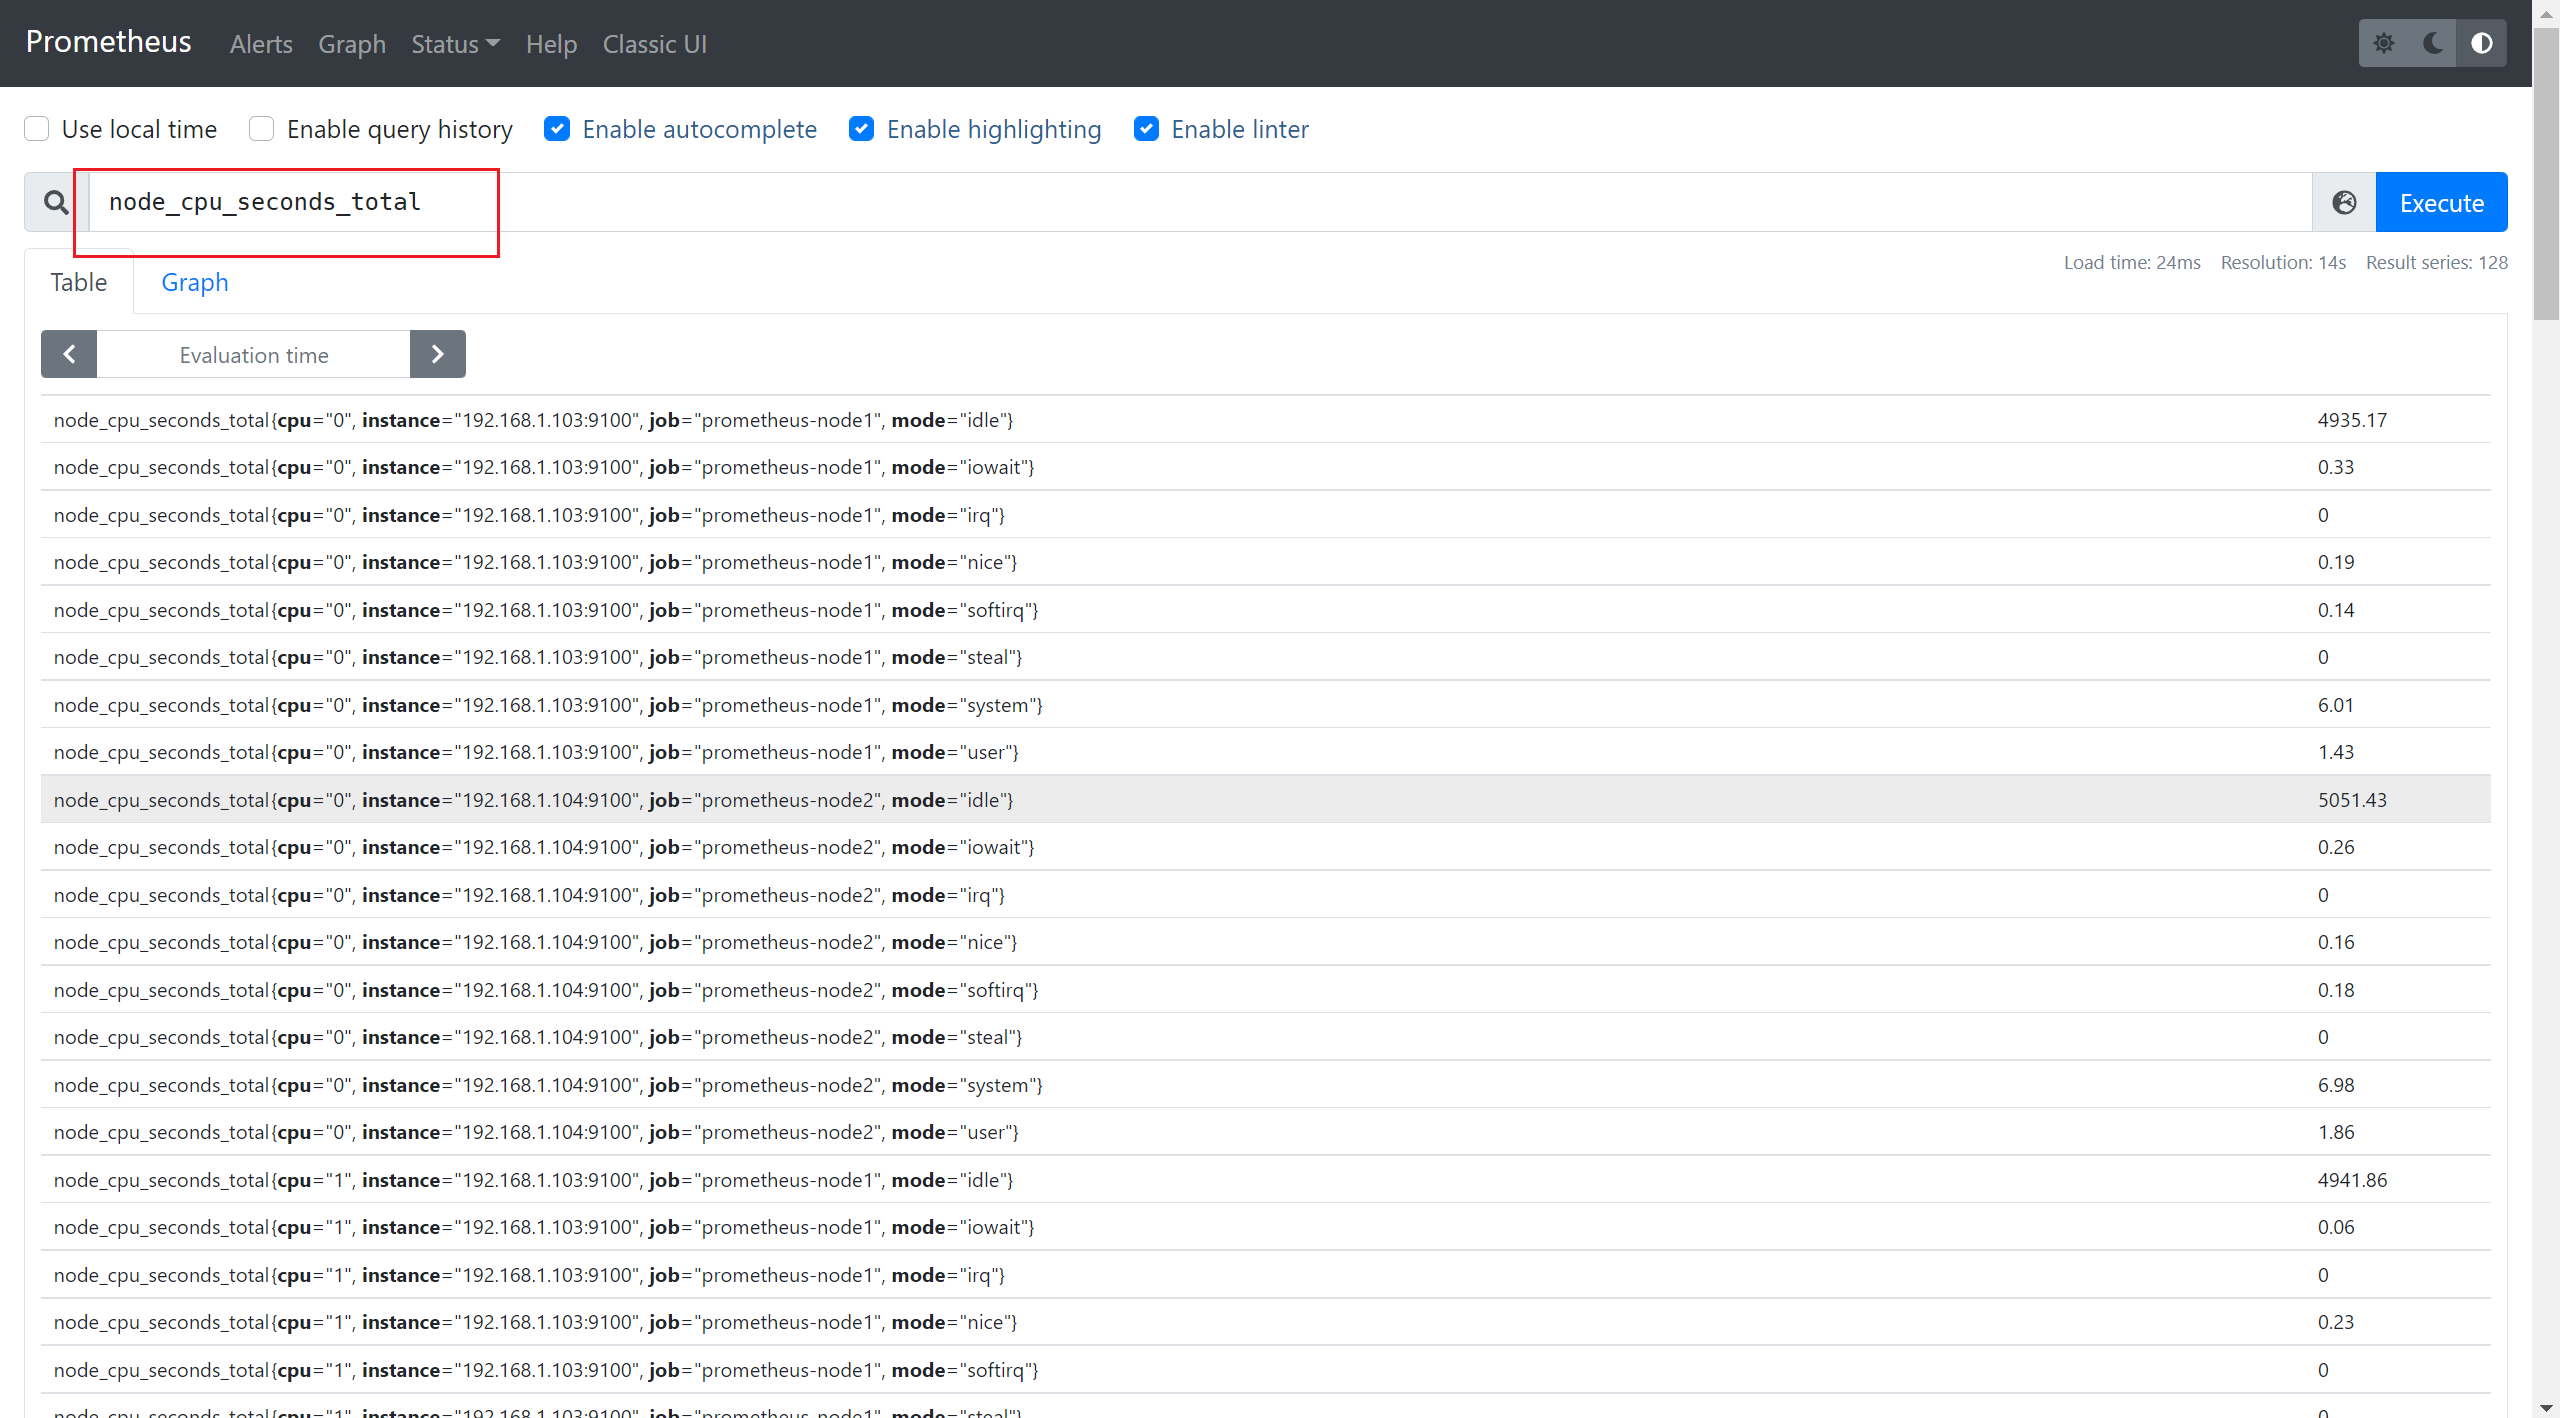
6)数据查询验证
7)安装InfluxDB数据库
InfluxDB是业界流行的一款时间序列数据库,其使用go语言开发。InfluxDB以性能突出为特点,具备高效的数据处理和存储能力,目前在监控和IOT 等领域被广泛应用。
1、导入yum仓库

[root@influxdb ~]# cat <<EOF | sudo tee /etc/yum.repos.d/influxdb.repo
[influxdb]
name = InfluxDB Repository - RHEL \$releasever
baseurl = https://repos.influxdata.com/rhel/\$releasever/\$basearch/stable
enabled = 1
gpgcheck = 1
gpgkey = https://repos.influxdata.com/influxdb.key
EOF


2、安装InfluxDB
[root@prometheus-master1 ~]# yum install influxdb -y

3、启动influxdb
[root@influxdb ~]# systemctl start influxdb
[root@influxdb ~]# systemctl enable influxdb

4、查看端口,默认是8086
[root@influxdb ~]# netstat -antup |grep 8086
tcp6       0      0 :::8086                 :::*                    LISTEN      2356/influxd
[root@influxdb ~]#

5、登录InfluxDB,创建名称为prometheus的库
[root@influxdb ~]# influx                  #登录数据库
Connected to http://localhost:8086 version 1.8.10
InfluxDB shell version: 1.8.10
> create database prometheus               #创建数据库
> show databases                           #查看数据库
name: databases
name
----
_internal
prometheus
>
8)安装适配器
方法1:

1、下载Prometheus源码文件

[root@influxdb ~]# git clone https://github.com/prometheus/prometheus.git
[root@influxdb ~]#cd /root/prometheus/documentation/examples/remote_storage/remote_storage_adapter
[root@influxdb remote_storage_adapter]# go build    #此处如果报错,则先安装golang
[root@influxdb remote_storage_adapter]# nohup ./remote_storage_adapter --influxdb-url=http://localhost:8086/ --influxdb.database=prometheus --influxdb.retention-policy=autogen  &  #启动适配器

2、查看端口
[root@influxdb remote_storage_adapter]# netstat -antup |grep 9201
tcp6       0      0 :::9201                 :::*                    LISTEN      4534/./remote_stora

方法2:
修改prmetheus.yml的配置文件(顶行写)
  remote_write:
  - url: "http://192.168.10.10:8086/api/v1/prom/write?db=prometheus"
remote_read:
  - url: "http://192.168.10.10:8086/api/v1/prom/read?db=prometheus"

注意:如果是方法2,则第9步可以忽略不配置
9)修改prometheus.yml文件,添加远程读写的配置内容(可选)
remote_write:              #顶行写
  - url: "http://192.168.1.105:9201/write"   #这里指的是influxdb所在服务器的IP和端口
remote_read:
  - url: "http://192.168.1.105:9201/read"
其他参考配置:
remote_write:
    url: <string>
    [ remote_timeout: <duration> | default = 30s ]
    write_relabel_configs:
    [ - <relabel_config> ... ]
    basic_auth:
    [ username: <string> ]
    [ password: <string> ]
    [ bearer_token: <string> ]
    [ bearer_token_file: /path/to/bearer/token/file ]
    tls_config:
    [ <tls_config> ]
    [ proxy_url: <string> ]
remote_read:
    url: <string>
    required_matchers:
    [ <labelname>: <labelvalue> ... ]
    [ remote_timeout: <duration> | default = 30s ]
    [ read_recent: <boolean> | default = false ]
    basic_auth:
    [ username: <string> ]
    [ password: <string> ]
    [ bearer_token: <string> ]
    [ bearer_token_file: /path/to/bearer/token/file ]
    [ <tls_config> ]
    [ proxy_url: <string> ]
**注释 :**其中url用于指定远程读写的HTTP服务地址,如果该URL启动了认证则可以通过basic_auth进行安全认证配置;对于https的支持需要设定tls_concig;proxy_url主要用于Prometheus无法直接访问适配器服务的情况下;write_relabel_configs用于标签重写功能。
配置完成后,重启Prometheus。在实例启动后,我们可以看到InfluxDB已经开始存储监控指标。
[root@prometheus-master1 prometheus-2.32.1.linux-amd64]# nohup ./prometheus --config.file=/usr/local/prometheus-2.32.1.linux-amd64/prometheus.yml & #重启prometheus
10) 查看influxdb的数据
[root@influxdb ~]# influx                  #登录数据库
Connected to http://localhost:8086 version 1.8.10
InfluxDB shell version: 1.8.10
> use prometheus               #切换数据库
> SHOW MEASUREMENTS            #查看数据库metrics值
name: measurements
name
----
go_gc_duration_seconds
go_gc_duration_seconds_count
go_gc_duration_seconds_sum
go_goroutines
go_info
go_memstats_alloc_bytes
go_memstats_alloc_bytes_total
go_memstats_buck_hash_sys_bytes
go_memstats_frees_total
go_memstats_gc_cpu_fraction
go_memstats_gc_sys_bytes
go_memstats_heap_alloc_bytes
go_memstats_heap_idle_bytes
go_memstats_heap_inuse_bytes
go_memstats_heap_objects
go_memstats_heap_released_bytes
go_memstats_heap_sys_bytes
go_memstats_last_gc_time_seconds
go_memstats_lookups_total
go_memstats_mallocs_total
go_memstats_mcache_inuse_bytes
go_memstats_mcache_sys_bytes
go_memstats_mspan_inuse_bytes
......
在数据写入成功后,我们可以试着停止Prometheus服务,同时删除本地data目录的监控数据,模拟Promthues数据丢失的情况后重启服务。重新打开Prometheus后,如果还可以正常查询到本地存储已删除的历史数据记录,则代表配置正常。
1、停止prometheus
[root@prometheus-master1 prometheus-2.32.1.linux-amd64]# jobs -l
[2]+ 19437 Running                 nohup ./prometheus --config.file=/usr/local/prometheus-2.32.1.linux-amd64/prometheus.yml &
[root@prometheus-master1 prometheus-2.32.1.linux-amd64]# kill -9 19437

2、删除本地数据
[root@prometheus-master1 prometheus-2.32.1.linux-amd64]# cd data/
[root@prometheus-master1 data]# rm -rf *

3、重启prometheus
[root@prometheus-master1 prometheus-2.32.1.linux-amd64]#  nohup ./prometheus --config.file=/usr/local/prometheus-2.32.1.linux-amd64/prometheus.yml &
11)查看数据
3.12 扩展:使用alertmanager来完成告警
【如果是配置的QQ邮箱告警,请在QQ邮箱设置中,开启smtp】
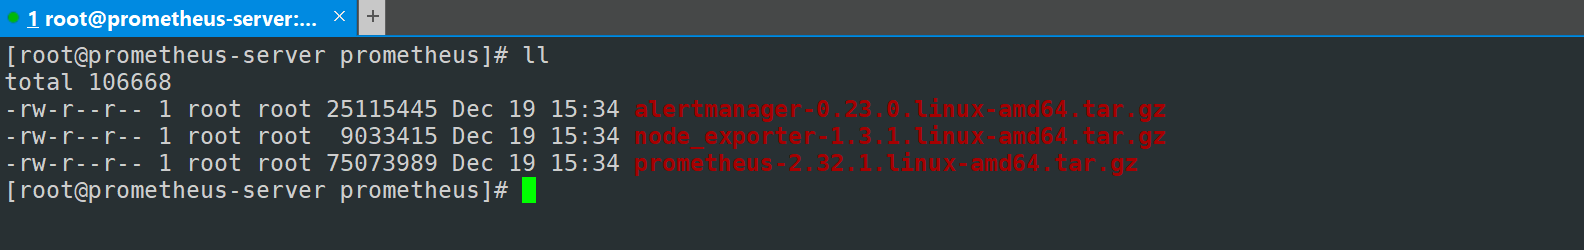
1)安装alertmanager
[root@prometheus-server prometheus]# tar zxvf alertmanager-0.23.0.linux-amd64.tar.gz -C /usr/local/
alertmanager-0.23.0.linux-amd64/
alertmanager-0.23.0.linux-amd64/alertmanager.yml
alertmanager-0.23.0.linux-amd64/LICENSE
alertmanager-0.23.0.linux-amd64/NOTICE
alertmanager-0.23.0.linux-amd64/alertmanager
alertmanager-0.23.0.linux-amd64/amtool
2)将alertmanager的执行脚本放置到系统的环境变量路径中
[root@prometheus-server ~]# cp /usr/local/alertmanager-0.23.0.linux-amd64/{amtool,alertmanager} /usr/local/bin/
3)查看安装是否正常
[root@prometheus-server ~]# alertmanager --version
alertmanager, version 0.23.0 (branch: HEAD, revision: 61046b17771a57cfd4c4a51be370ab930a4d7d54)
  build user:       root@e21a959be8d2
  build date:       20210825-10:48:55
  go version:       go1.16.7
  platform:         linux/amd64
[root@prometheus-server ~]#
4)配置 Alertmanager
先在prometheus_server中添加告警配置
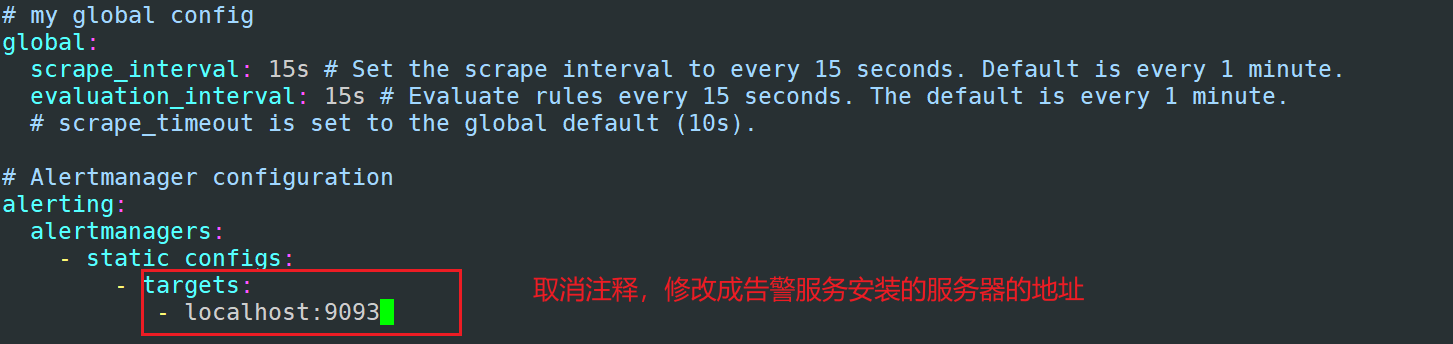
[root@prometheus-server ~]# vim /etc/prometheus/prometheus.yml
alerting:
  alertmanagers:
    - static_configs:
        - targets:
           - localhost:9093
rule_files:
  - /etc/prometheus/rules/host_rules.yml
5)定义rules告警规则
[root@prometheus-server prometheus]# mkdir rules
[root@prometheus-server prometheus]# cd rules/
[root@prometheus-server rules]# vim host_rules.yml
添加如下内容:
groups:
- name: 'Linux server'
  rules:
  - alert: InstanceDown
    expr: up == 0
    for: 5s
    labels:
      severity: page
    annotations:
      description: has been down for more then 5s
6)完成后重启prometheus
[root@prometheus-server ~]# prometheus --config.file "/etc/prometheus/prometheus.yml"&
7)登录prometheus,查看配置
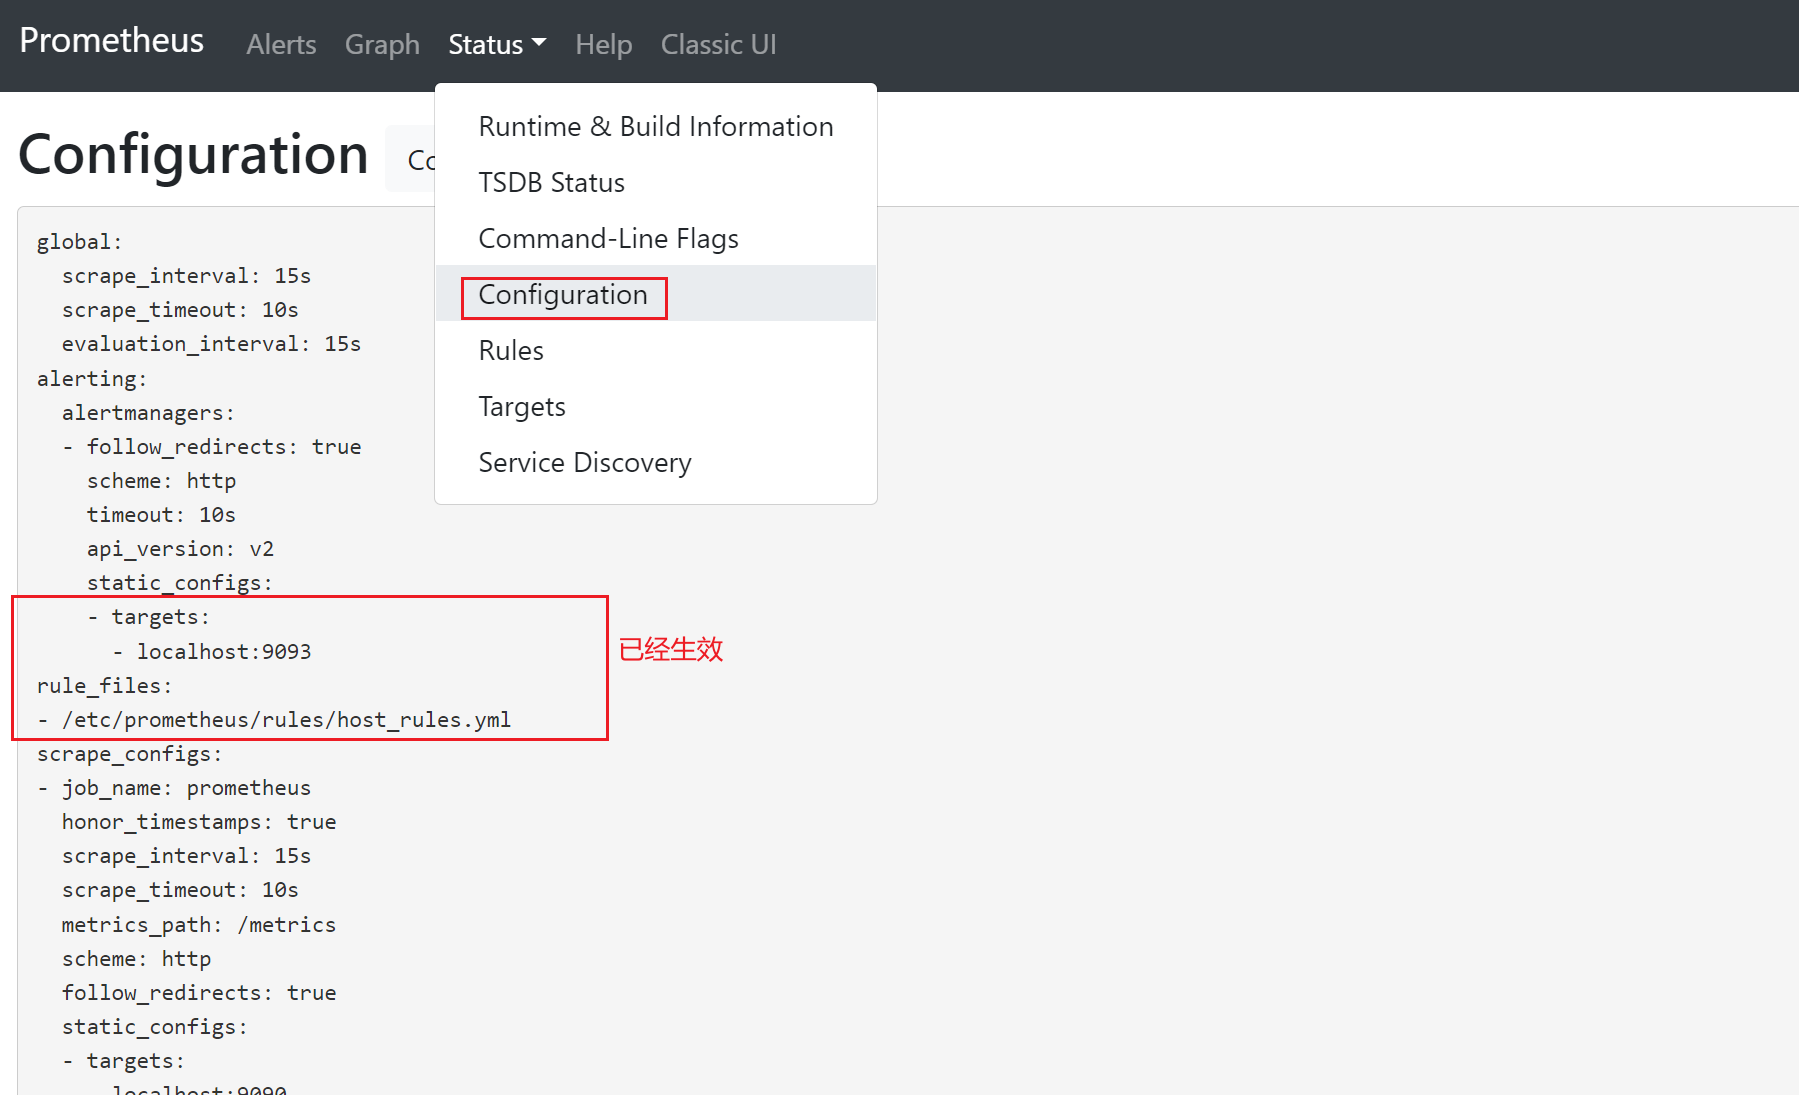
8)查看alerts配置
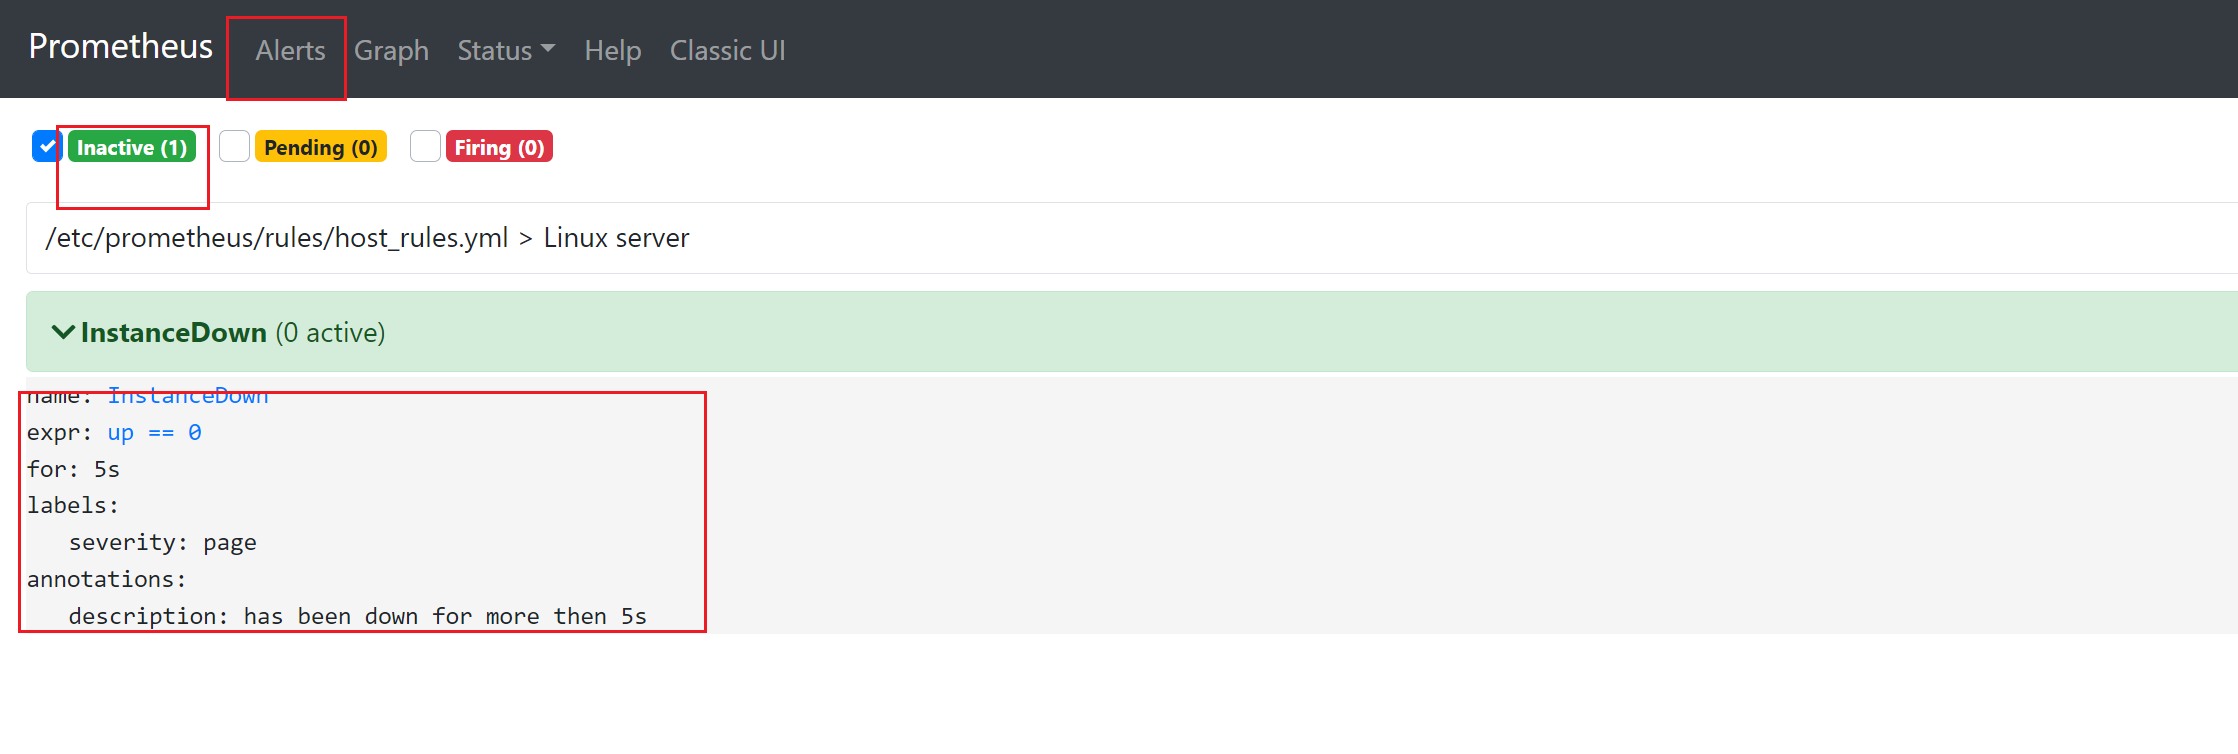
9)模拟node_exporter故障,查看是否有告警【生产中,不要直接kill】
[root@prometheus-server prometheus]# jobs -l
[2]-  1539 Running                 node_exporter &  (wd: ~)
[7]+  2396 Running                 prometheus --config.file "/etc/prometheus/prometheus.yml" &
[root@prometheus-server prometheus]# kill -9 1539
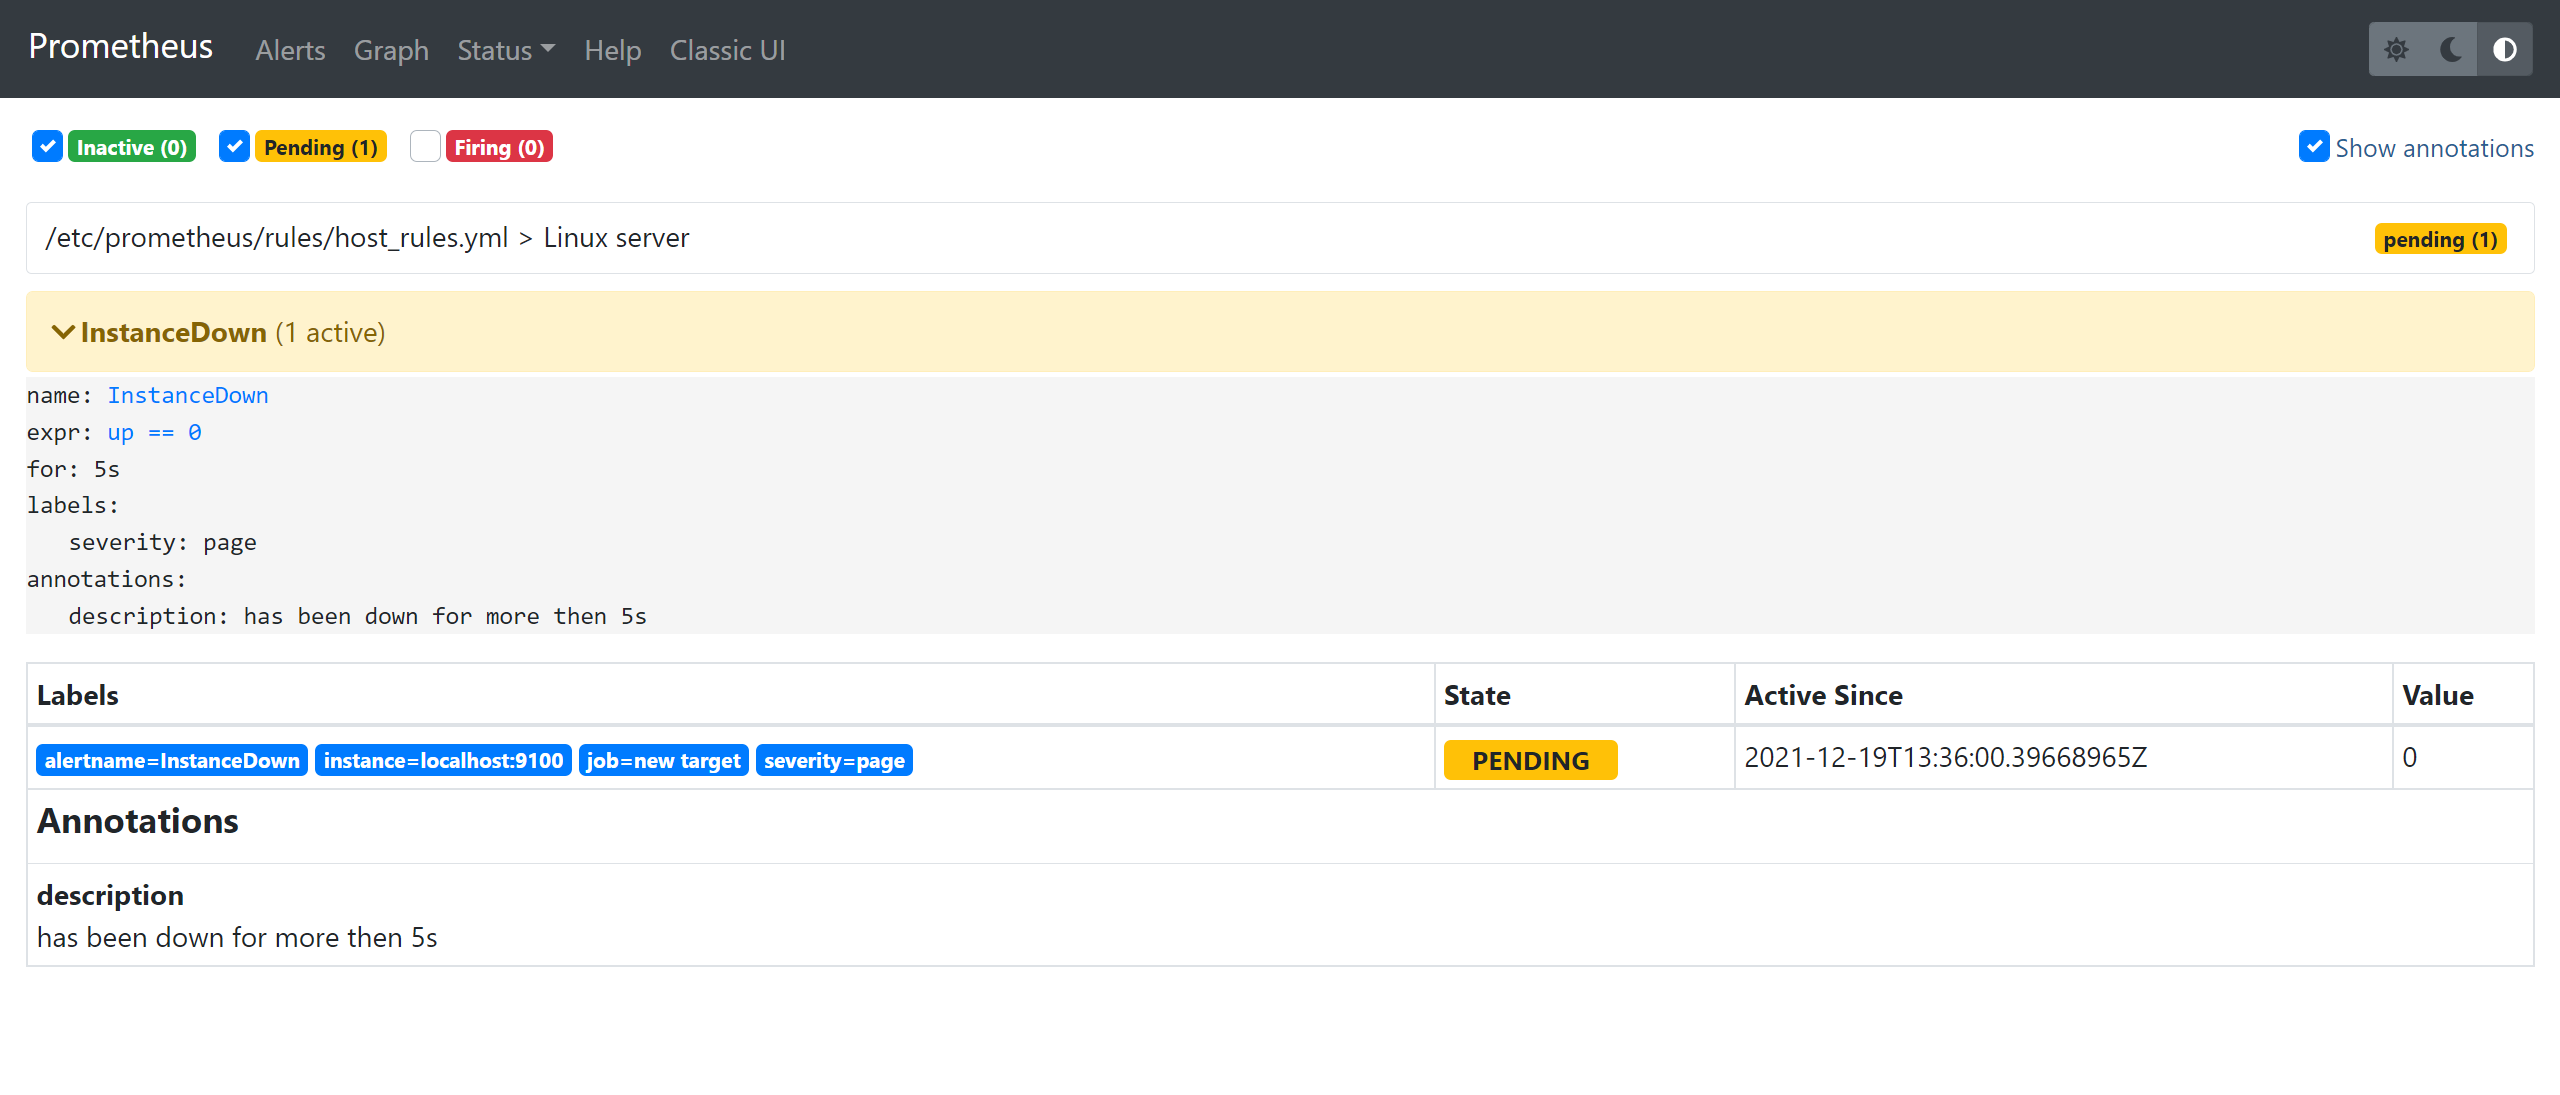
查看prometheus,已经有了告警信息了
10)编写alertmanager.yml文件【注意语法格式,严格按照如下的格式写】
[root@prometheus-server alertmanager]# vim alertmanager.yml

global:
  smtp_smarthost: 'smtp.qq.com:465'
  smtp_from: '2041598918@qq.com'
  smtp_auth_username: '2041598918@qq.com'
  smtp_auth_password: 'qillxoxxnmvvcacd' # 这里是邮箱的授权密码,不是登录密码
  smtp_require_tls: false
route:
  group_by: ['alertname']
  group_wait: 30s
  group_interval: 5m
  repeat_interval: 10m
  receiver: default-receiver
receivers:
- name: 'default-receiver'
  email_configs:
  - to: '2041598918@163.com'
    headers: { Subject: "[WARN] 节点故障,请及时处理" }
    send_resolved: true
- name: 'web.hook'
  webhook_configs:
  - url: 'http://127.0.0.1:5001/'
inhibit_rules:
  - source_match:
      severity: 'critical'
    target_match:
      severity: 'warining'
    equal: ['alertname', 'dev', 'instance']
参数解析
smtp_smarthost:是用于发送邮件的邮箱的 SMTP 服务器地址 + 端口;
smtp_auth_password:是发送邮箱的授权码而不是登录密码;
smtp_require_tls:不设置的话默认为 true,当为 true 时会有 starttls 错误,为了简单这里设置为 false;
receivers : 定义邮箱的接受者
headers:为邮件标题;
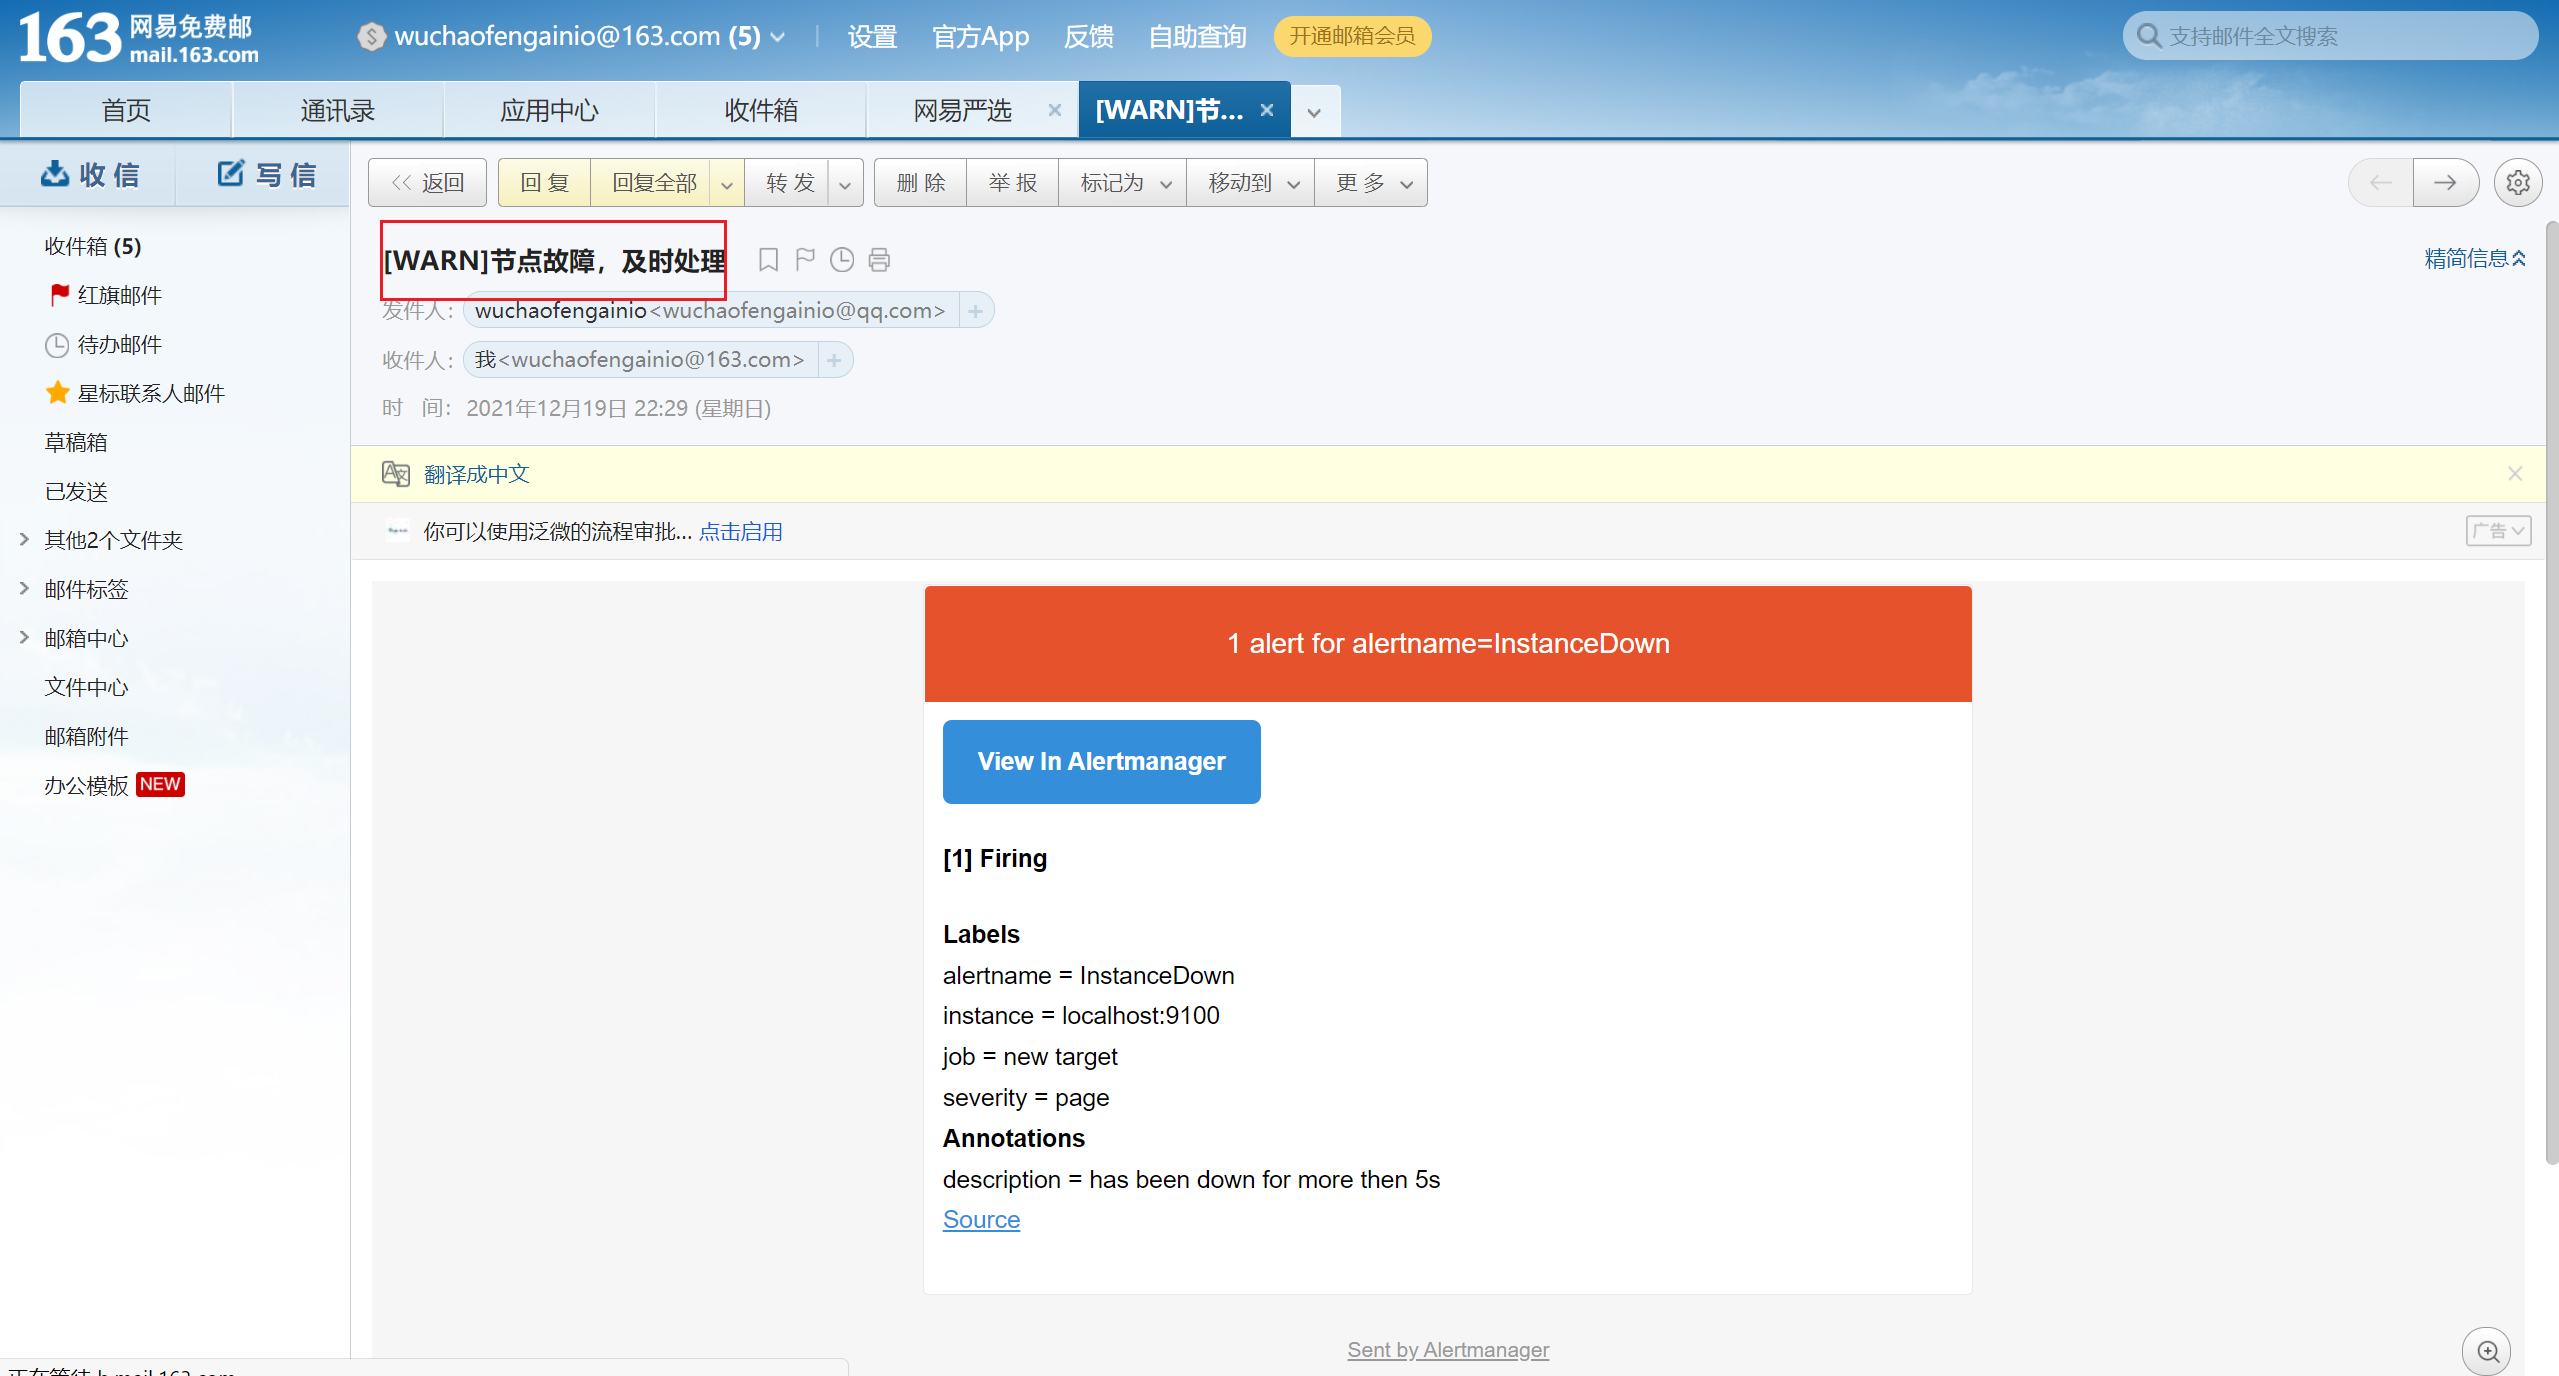
11)模拟故障,将node_exporter宕掉
[root@prometheus-server rules]# jobs -l
[10]   2528 Running                 prometheus --config.file "/etc/prometheus/prometheus.yml" &  (wd: /etc/alertmanager)
[11]-  2550 Running                 alertmanager --config.file '/etc/alertmanager/alertmanager.yml' &  (wd: /etc/alertmanager)
[12]+  2585 Running                 node_exporter &

[root@prometheus-server rules]# kill -9 2585
12)查看163是否有邮件收到
13)恢复服务
[root@prometheus-server ~]# node_exporter &
[root@prometheus-server ~]# jobs -l
[12]   2607 Running                 prometheus --config.file "/etc/prometheus/prometheus.yml" &  (wd: /etc/prometheus/rules)
[13]-  2618 Running                 alertmanager --config.file '/etc/alertmanager/alertmanager.yml' &  (wd: /etc/prometheus/rules)
[15]+  2647 Running                 node_exporter &
[root@prometheus-server ~]#